Glacial Aquifer System Groundwater Availability Study
ContactHoward W. Reeves

USGS IN YOUR STATEUSGS Water Science Centers are located in each state. 
|
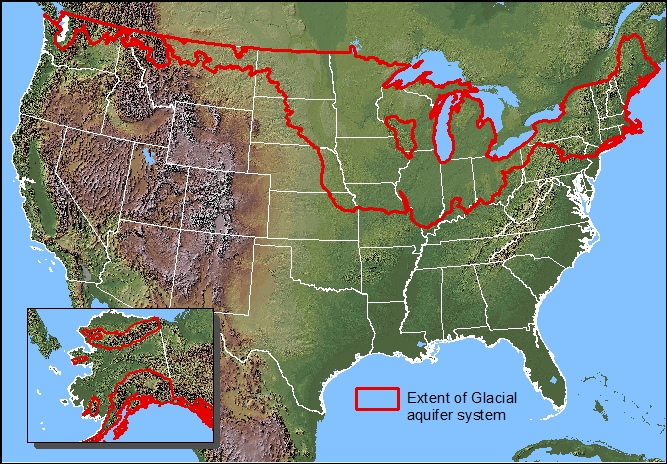
The USGS Groundwater Resources Program began an assessment of groundwater availability in the principal aquifers of the U.S. in 2004. Several studies have been completed: Central Valley, Denver Basin, Southeast Coastal Plain, Lake Michigan Basin, Mississippi Embayment, and Columbia Plateau; and several are underway: High Plains, North Atlantic Coastal Plain, and Lower Tertiary/Upper Cretaceous. The Glacial Sand and Gravel Principal Aquifer is the next to be considered for the program. These regional studies aim to provide the information required for a national assessment of groundwater resources including the status of the resource, trends in groundwater resources with time, and potential changes or limitations of the system in the future. The glacial aquifer system is an important source of water for public supply, irrigation, and industrial uses. This system often is at land surface which makes it vulnerable to contamination from surface activities and important in providing baseflow to streams. The vast extent, diversity and heterogeneity in hydrogeology, and range of climatic conditions for the glacial aquifer system impose challenges to this groundwater availability study. Study AreaThe glacial aquifer system extends from Maine to Alaska (Figure 1). It is comprised of material deposited by Laurentide and Cordilleran ice sheets which extended into North America in series of advances and retreats of continental glaciers between 2.5 million and 12,000 years ago (Dorr and Eshman, 1970; Booth and others, 2003; Marshall and others, 2003; Mickelson and Colgan, 2003). In some areas, more recent glaciation removed old material and only material from the last advance is found; but, in other areas, glacial material deposited by sequential advances and retreats is present. The dynamics of de-glaciation and the resulting landforms and glacial geology are subjects of much research that can help provide a foundation for the glacial aquifer study. The landforms and landsystems produced by deposited glacial material and the characteristics of the material within these deposits determine the aquifer characteristics for glacial deposits and understanding glacial landsystems may provide insight to groundwater yield, aquifer hydraulic properties, and, ultimately, groundwater availability at both local and regional scales (Eyles, 1983; Eyles and others, 1985; Anderson, 1989).
ClimateClimate also varies substantially across the glacial aquifer system. For example, the average annual precipitation from 1981-2010 (1971 to 2000 for Alaska) was less than 10 inches in parts of Montana and North Dakota and over 100 inches in the Pacific northwest and parts of Alaska (Figure 2). Additionally, average annual maximum temperatures range from about 50 degrees F in the midwest to about 42 degrees F in Alaska (Figure 3). The average annual minimum temperatures ranges from about 40 degrees F in the midwest to about 15 degrees F in Alaska (Figure 4). These climate variations are coupled with hydrogeologic conditions to provide a major control on the groundwater availability of the system. 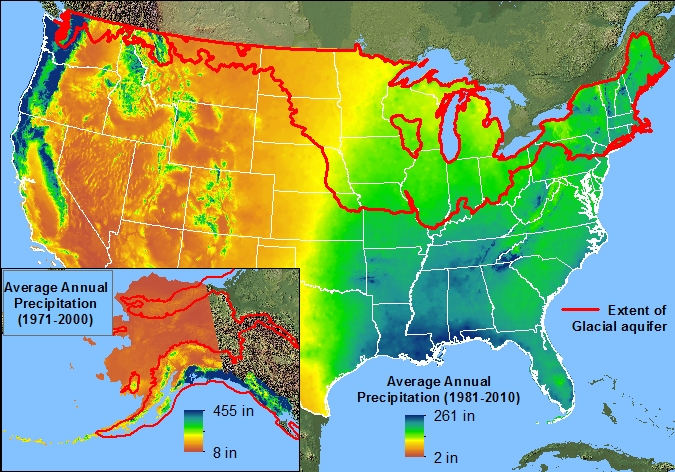 Figure 2. Map of annual average precipitation in the U.S. from 1981 to 2010. The data for laska is from 1971 to 2000. Precipitation data are from the PRISM Climate group. 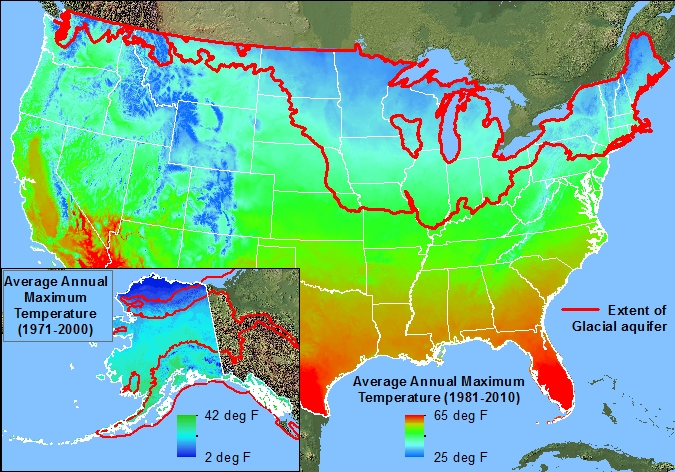 Figure 3. Map of annual average maximum temperature in the U.S. from 1981 to 2010. The data for Alaska is from 1971 to 2000. Temperature data are from the PRISM Climate group. 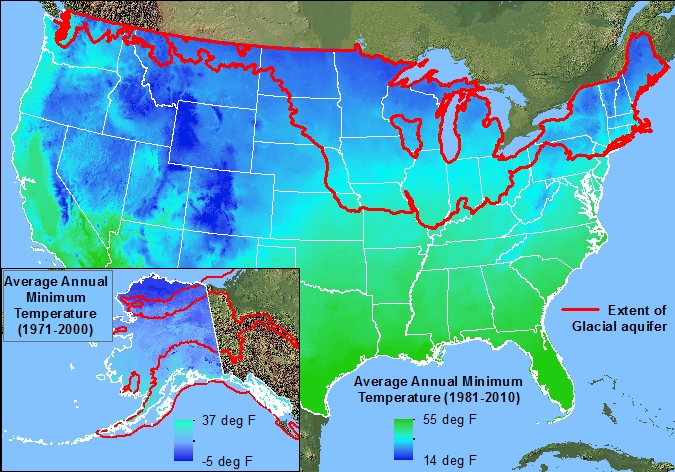 Figure 4. Map of annual average minimum temperature in the U.S. from 1981 to 2010. The data for laska is from 1971 to 2000. Temperature data are from the PRISM Climate group. RechargeThe amount of water available to recharge an aquifer can be estimated by the amount of precipitation minus the amount of potential evapotranspiration (PET) (water lost to the atmosphere from plants transpiring and evaporation given no deficiencly of water in the soil). In arid areas, precipitation is usually less than PET and little water is available for recharge. In wetter areas, precipitation usually exceeds PET, therefore, water is available for recharge (Figure 5).  Figure 5. Map showing gridded values of 1971-2000 average precipitation minus average potential evapotranspiration (PET) (precipitation and PET estimates from McCabe and Wolock, 2011). The red line indicates zero, where average precipitation equals PET. PET exceeds average precipitation in brown areas, and precipitation exceeds PET in green areas. Groundwater levels in glacial deposits near the zero line can vary greatly from to year to year due to variations in precipitation. Groundwater discharge to streams and wetlands decreases quickly and they can tend to dry out during a single dry year. In wetter settings, where the map is greener, the groundwater levels in the glacial deposits tend to be less variable during short wet and dry cycles. References |
![]() U.S. Department of the Interior |
U.S. Geological Survey
U.S. Department of the Interior |
U.S. Geological Survey
URL: http://mi.water.usgs.gov/projects/WaterSmart/background.html
Page Contact Information: gs-w-milns_webmaster@usgs.gov
Page Last Modified: Wednesday, 26-Dec-2012 17:58:46 EST