
Michigan has 67 water supplies that use surface-water sources. These supplies provide drinking water to over 60 percent of the State's population, or about 6 million people. The U.S. Geological Survey and Michigan Department of Environmental Quality are cooperating on a project to assess the risk to community surface-water sources from potential contaminant sources. Section 1453a of Public Law 104-182, reauthorization of the Safe Drinking Water Act of 1996, requires Federal guidance and defines State requirements for a source-water assessment program. The U.S. Environmental Protection Agency published the State Source-water Assessment and Protection Programs Guidance in August 1997 to assist States in developing an acceptable source-water assessment program. By statute, a State's source-water assessment program must complete assessments for all sources of public drinking water that (1) define source-water areas, (2) list potential contaminant sites and contaminants of concern, and (3) determine raw water susceptibility to contamination. States then must work with public-water suppliers to inform the public of these results. Results of the assessments are to be presented in reports for each surface-water facility.
Inland lake and river intake assessments (8 supplies in Michigan) are watershed based. The assessment process for these source waters includes reviewing water-quality monitoring records and identifying potential contaminant sources. Great Lakes and Great Lakes Connecting Channels intake assessments (59 supplies) follow the "Assessment Protocol for Great Lakes Sources" developed by Great Lakes States in U.S. Environmental Protection Agency Region 5. Assessments include local data on land-use, contamination sources (sewer outfalls, leaking storage tanks, air deposition, etc.), information from local water-plant personnel (intake construction and location, influent quality, effects of weather, lake currents, etc.), and centralized State and Federal data resources (census data, permitted discharges). A pilot assessment completed for the Alpena, Michigan, water supply identified potential effects to the intake from a nearby river, atmospheric conditions, and two storm-sewer outfalls. The preliminary Alpena assessment was received favorably by the community, and provided the basis of a source-water protection program for the community.
In addition to methods established for the assessment of Great Lakes supplies, assessments of supplies that use Great Lakes Connecting Channels as their source (14 supplies) will be included in a two-dimensional, hydrodynamic flow model of the St. Clair River–Lake St. Clair–Detroit River system. The flow model will define source-water areas, track contaminant source-water-quality concerns, and assist in developing contingency plans. A partnership established among the Michigan Department of Environmental Quality, U.S. Geological Survey, U.S. Environmental Protection Agency, U.S. Army Corps of Engineers, and the Detroit Water and Sewerage Department, with assistance from Environment Canada, will complete this model. The partnership received American Water Works Association Research Foundation funds to enhance the contaminant-tracking model capabilities.
On a national scale, the U.S. Environmental Protection Agency, States, public-water suppliers, and other stakeholders throughout the country are developing a National Source-Water Protection Strategy. U.S. Environmental Protection Agency guidelines explicitly require involving the public in the source-water assessment process, and in the release of completed assessments. These guidelines include a coordinated effort between the Clean Water Act and the Safe Drinking Water Act programs to benefit the protection of watersheds and sources of public drinking water, and to benefit future programs and local source-water protection efforts. The goal of the Michigan source-water assessment program is to increase public awareness of source-water issues. The expected outcome of this goal is local source-water protection initiatives that will protect drinking water and improve watershed protection. Communities can use source-water assessments to develop source-water protection programs that incorporate watershed-management plans and best management practices. The Michigan Department of Environmental Quality will use source-water assessments to determine future public-water-supply contaminant monitoring waivers.
Source-water, source-water assessment, source-water protection, drinking water, drinking water protection, Safe Drinking Water Act, Clean Water Act, public-water supplies.
The 1996 Amendments to the Safe Drinking Water Act (SDWA; Section 1453) require States to develop and implement a source-water assessment program (SWAP) to: (a) delineate the boundaries of areas that supply water to public supplies and to define the source-water areas (SWAs), (b) identify potential sources of regulated and unregulated contaminants in the SWA, and (c) determine the susceptibility of public-water supplies to those contaminants. Using information obtained for the assessments, communities are encouraged to develop source-water protection plans to protect their drinking water.
The Michigan Department of Environmental Quality (MDEQ) has developed a SWAP using a Citizens Advisory Committee, which includes a Technical Advisory Committee and a Public Advisory Committee, to guide and review the process. MDEQ expanded its present U.S. Environmental Protection Agency (USEPA)-approved ground-water-based drinking-water protection program (also known as the wellhead-protection program) to include surface-water sources. Information regarding the SWAP, the assessment protocol, and maps of the public water-supplies are discussed by Brogren (1999).
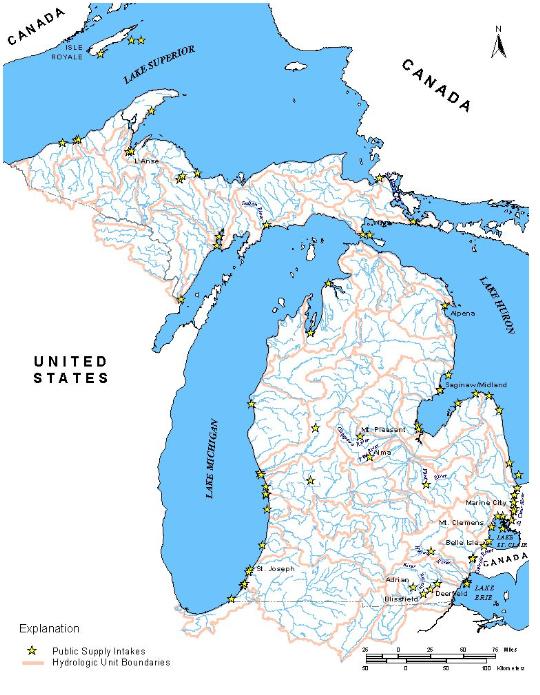
The MDEQ and the U.S. Geological Survey (USGS) are implementing the SWAP in Michigan. The USGS is performing assessments of Michigan's 67 community surface-water supplies (figure 1, table 1) that are consistent with source-water assessment guidelines developed by Brogren (1999), the Oregon Department of Environmental Quality and Oregon Health Division (1999), and Sweat and others (2000). The USGS performed pilot assessments of three surface-water supplies with Great Lakes intakes, three surface-water supplies with inland river and (or) inland lake intakes, and three surface-water supplies with Great Lakes connecting channels intakes (table 2). Assessments include delineated SWAs, inventories of potential contaminants, and susceptibility analyses. USGS and MDEQ performed contaminant inventories and susceptibility analyses of the nine pilot supplies to develop methods now used to assess the remaining 58 supplies. Complete assessments include a map of the SWA, a table of potential contaminant sources by permit type, the location of potential contaminant sources shown on a map, the susceptibility determination, and a narrative of procedures followed for conducting the assessment. Assessments use geographic information system (GIS)-based analyses for determining relations among potential contaminant sources in susceptible areas, soil permeability, land-use, and other environmental, political, and geographical features.
Table 1. — Water supplies in Michigan using surface-water as their source, by supply type
| Supply Source | Supply Type | Number of Supplies Using this Source |
|---|---|---|
| Chippewa River | Inland River | 1 |
| Flint River | 1 | |
| Huron River | 1 | |
| Indian River | 1 | |
| Pine River | 1 | |
| River Raisin | 3 | |
| St. Mary River | Great Lakes Connecting Channel | 2 |
| St. Clair River | 7 | |
| Lake St. Clair | 4 | |
| Detroit River | 3 | |
| Lake Michigan | Great Lake | 20 |
| Lake Superior | 12 | |
| Lake Huron | 13 |
Table 2. – Water supplies participating in pilot assessments
| Supply Type | Supply Source | Community Water Supply Assessed |
|---|---|---|
| Inland River | River Raisin | Adrian |
| Blissfield | ||
| Deerfield | ||
| Great Lakes Connecting Channel | St. Clair River | Marine City |
| Lake St. Clair | Mt. Clemens | |
| Detroit River | Detroit - Belle Isle | |
| Great Lake | Lake Michigan | St. Joseph |
| Lake Superior | L'Anse | |
| Lake Huron | Alpena |
Figure 1. Location of Water Supplies in Michigan using Surface Water as their Source.
Michigan image Once all assessments are completed and approved, MDEQ will: (a) provide technical assistance to communities for source-water protection, (b) initiate community outreach programs, and (c) use a GIS framework to display the results of the assessments. The assessment process is described in the following sections.
DELINEATION OF SURFACE SOURCE-WATER AREAS
The SWA delineation process identifies watershed boundaries (Lanier and Falls, 1999). The extent of the SWA is determined by identifying the watershed, or portion thereof, that discharges toward a known surface-water intake. Further refinements to SWA delineation can stem from water-plant supervisors who are able to indicate specific effects on their intake. For a Great Lakes intake, where water may be diverted from one watershed to another, the delineation of source-water areas includes all applicable watersheds that potentially would contribute water to the intake.
A two-dimensional, hydrodynamic flow model of the St. Clair River-Lake St. Clair-Detroit River system will define source-water areas for connecting-channels supplies. Model results allow for determination of contributing areas from watersheds tributary to the connecting channels. The model is being developed through a partnership among MDEQ, USGS, USEPA, U.S. Army Corps of Engineers, and Detroit Water and Sewerage Department, with assistance from Environment Canada (Holtschlag and Brogren, 2000). The model will be enhanced with a particle-tracking routine to aid in determining travel mechanisms and origins of potential contaminants (American Water Works Association Research Foundation, 2001).
The USGS developed GIS-based methods for delineating SWAs for surface-water supplies. This process begins by using available digital watershed boundaries, surface-water intake locations, elevation models (variable scale), and river-reach data (USEPA, 1997a, 1997b, 1998) to delineate Michigan's major watersheds and sub-watersheds. Location data are assembled from field and office visits, and incorporated into a GIS framework to determine the downstream limit to each source-water area. Present surface-water intake locations for the 67 public surface-water supplies are confirmed by using the global positioning system during site visits by MDEQ and USGS. The delineated source-water areas for the Alpena, Michigan intake in Thunder Bay on Lake Huron, the delineated SWA for the Adrian, Michigan intake in Lake Adrian on Wolf Creek, and the delineated source-water area for the Detroit-Belle Isle, Michigan intake in the Detroit River are shown in Figure 2. SWA's are shown for Great Lakes, Great Lake Connecting Channels, and inland river intakes to illustrate the differences among assessment protocols for each type of source water.
DELINEATION OF THE CRITICAL ASSESSMENT ZONE AND SUSCEPTIBLE AREA
After delineating a watershed, a critical assessment zone (CAZ), as defined in the Assessment Protocol for Great Lakes Sources (Brogren, 1999, Appendix L, pp. 99-103), is delineated for each intake. In addition to the CAZ, susceptible areas are established around surface-water features within the watershed to determine vulnerability of the public-water supply to potential contaminants. Susceptible areas serve as zones used for focusing PCS inventories. Additionally, susceptible areas designate where potential risks of contamination by spills or other contaminant releases are present, and are considered nominal. Thus, these areas can vary in size based on site-specific data and, where available, time-of-travel calculations performed by the public-water supply.
Figure 2. Source-water for the Adrian, Alpena, and Detroit - Belle Isle, Michigan, Water Supply Intakes.
Determining the susceptible area by the radius and setback methods involves use of a fixed horizontal distance from the intake. In steep terrain, a slope distance also can be calculated as needed for site-specific analyses. The latter would be preferred for steep banked streams with rapidly permeable soils, such as in alluvial fill valleys, or in artificially channeled segments of rivers.
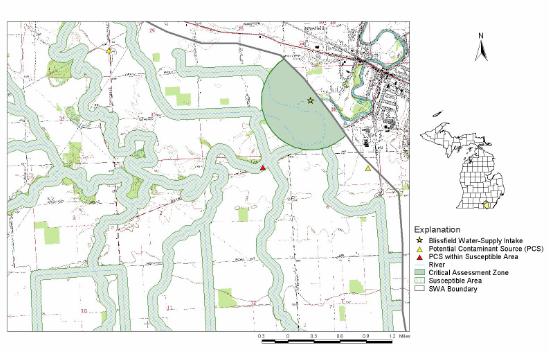
The CAZ for river intakes is a 3,000-foot (ft) radius upstream from the center of the intake, and the susceptible area is a 300 ft setback from the shores of the intake stream and all perennial tributaries within a specified time of travel (fig. 3). This distance is consistent with the designation of riparian buffers (susceptible areas).
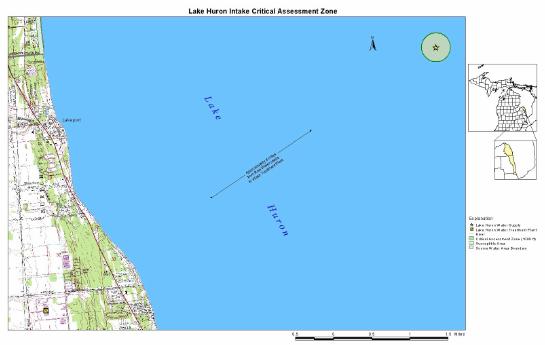
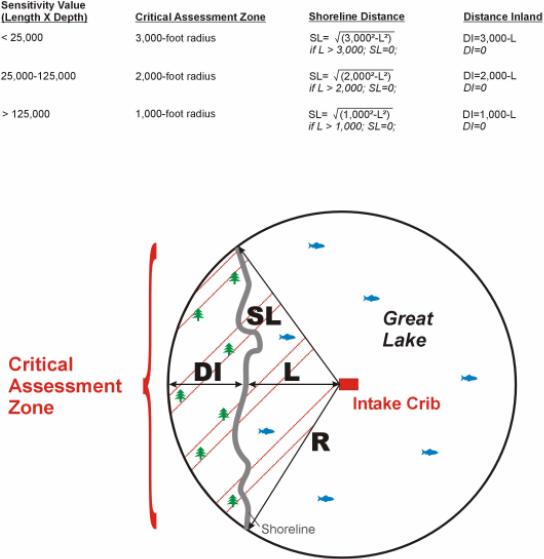
For Great Lakes intakes, the CAZ is defined by the distance from shore of the intake (L) in feet, and the water depth of the intake crib (D) in feet. Multiplying L times D yields a sensitivity value (Brogren, 1999, p. 100) that determines the CAZ for Great Lakes intakes (fig. 4). The CAZ will be a 1,000, 2,000, or 3,000 ft radius from the intake. For example, a Great Lake intake with an offshore distance of 200 ft, and a water depth of 40 ft, has a sensitivity value of 8,000 (unitless), and a CAZ radius of 3,000 ft (Brogren, 1999, p. 100).
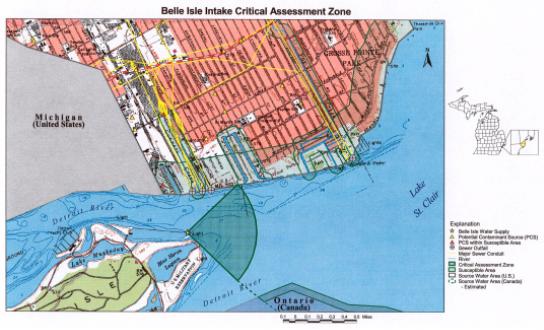
The susceptible area along the lakeshore is a buffer that is equal to the distance inland that the CAZ overlaps the shoreline, and follows the shoreline to the nearest stream that might affect the intake. The susceptible area also includes a 300 ft setback from the shores of all streams and all perennial tributaries flowing into the water body within the CAZ, and for larger watersheds, within a specified time of travel from stream mouths (figs. 5 and 6).
For Great Lakes connecting channels intakes, the CAZ and susceptible area is determined in a manner similar to Great Lakes intakes. Once the two-dimensional, hydrodynamic flow model is completed, the assessments for the Great Lakes connecting channels intakes will be refined to incorporate the contributing areas defined by the model results (Holtschlag and Brogren, 2000).
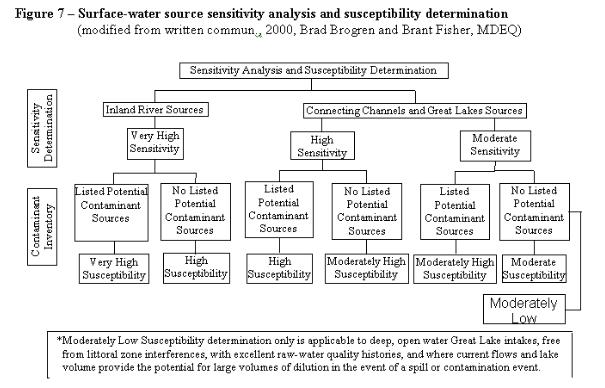
Sensitivity to contaminants is a measure of the relative protection afforded to the SWA by its environment. The sensitivity and susceptibility of SWAs was determined for each water-supply supply by applying the flow chart shown in figure 7. Protection is determined by the characteristics of the contributing area, including the potential for runoff (poorly permeable soils as opposed to very permeable soils (USDA, variably dated), volume of surface water that may contribute to dilution of potential contaminants (dilution), isolation of intake(s) (distance of intake from shore), and the likelihood of prevailing currents and (or) winds affecting the intake. Given that the Great Lakes contain large volumes of water relative to inland rivers and lakes, and that Great Lakes intakes generally are located away from land effects, Great Lakes intakes likely are less sensitive than inland river intakes and (or) inland lake intakes. Therefore, Great Lakes and connecting channel intakes generally are rated with moderate or high sensitivity, depending upon the depth of the intake and distance of the intake offshore. Because inland river intakes often are in shallow waters that are affected by human and other natural contaminants, these sources generally are rated as very highly sensitive.
Figure 3. – Critical assessment zone (CAZ) and susceptible area for the Blissfield, Michigan, water-supply on the River Raisin
Figure 4. – Critical assessment zone (CAZ) determination (modified from Brogren, 1999)
| Sensitivity Value | Critical Assessment Zone | Shoreline Distance | Distance Inland |
|---|---|---|---|
| <25,000 | 3,000-foot radius | SL=√(3000�-L�) | DI=3000-L |
| 25,000-125,000 | 2,000-foot radius | SL=√(2000�-L�) | DI=2000-L |
| if L>2000; SL=0 | if L>2000; DI=0 | ||
| >125,000 | 1,000-foot radius | SL=√(1000�-L�) | DI=1000-L |
CONTAMINANT-SOURCE INVENTORIES
After a SWA is delineated, potential sources of contamination are inventoried. Potential contaminant-source inventories are created with assistance from public water-supply operators, watershed councils, drinking-water protection committees, and local citizens. Inventories are compiled from available Federal, State, and local databases using a GIS for database manipulation and illustration design. This approach focuses on facilities, activities, and land-uses that MDEQ and local health departments consider high or moderate risks to drinking water.
Each inventory consists of identifying and locating potential sources of contaminants and includes the following steps:
- Create a land-use map for the SWA.
- Conduct database queries and plot applicable data on the land-use map.
- Compile other available sources of information.
- Provide a preliminary inventory form, land-use map, and contaminant inventory to public water-supply, planners, and community team.
- Field locate (optional) and verify potential high-risk activities.
- Finalize the inventory form and the land-use base map.
Figure 5. – Critical assessment zone (CAZ) for the Detroit Water and Sewerage Department Lake Huron intake in Lake Huron
Figure 6. – Critical assessment zone (CAZ) and susceptible area for the Detroit Water and Sewerage Department Belle Isle intake in the Detroit River
Figure 7. – Surface-water source sensitivity analysis and susceptibility determination (modified from written commun., 2000, Brad Brogren and Brant Fisher, MDEQ)
The contaminant-source inventory provides information about the location of potential contaminant sources, and information about potential contaminants used or stored within a SWA, especially those that present the greatest risks to a water supply. Contaminant-source inventory results are available for map display, depicting the spatial relation between the potential contaminant sources and the drinking-water intake, and serving as an effective means of educating the public about potential contaminants in their area. Finally, the contaminant-source inventory provides a reliable basis for developing a local management plan to reduce risks to water supplies.
Contaminants can be released to water bodies from a variety of sources. Potential sources of contamination can include, but are not limited to, industrial facilities, sewage- or waste-disposal sites, managed forest or agricultural lands, accidental transportation spills, small businesses, and residential activities. Principal contaminants of concern from nonpoint sources in Michigan include sediments, nutrients, microorganisms, and pesticides. Principal contaminants of concern from point sources in Michigan include volatile organic compounds, microorganisms, and petroleum compounds.
Contaminant inventories focus on potential sources of contaminants regulated under the SDWA. These inventories include contaminants with a maximum contaminant level, contaminants regulated under the USEPA surface-water treatment rule, and the microorganisms Cryptosporidium and Giardia lamblia. Four broad categories of contaminants affect the quality of water resources in Michigan, and include microorganisms (viruses such as Hepatitis A, Norwalk type; protozoa, such as Cryptosporidium, Giardia lamblia; and bacteria such as coliform (Escherichia coli, fecal, enterococcus)), turbidity and sediments, inorganics (such as nitrates and metals), and organics (such as volatile organic compounds, petroleum compounds, and semi-volatiles).
Scope of Potential Contaminant-Source Inventory
The potential contaminant-source inventory identifies and lists the location of major potential sources of contaminants of concern within a SWA. Potential sources of contamination are any facility or activity that stores, uses, or produces contaminants of concern at levels that could contribute to the detectable concentration of these contaminants in the source-waters of the public-water-supply (Brogren, 1999). Contaminants reach surface-water bodies from activities on or below the land surface. Contaminants may be attenuated, amplified, or altered during transport.
When considering potential risks to water bodies, water-treatment plant (WTP) personnel are asked what management practices and (or) pollution-prevention processes are used. Operating practices and environmental awareness varies among facility operators and landowners. Regardless of the quality of management practices or pollution-prevention processes utilized, the highest potential risks generally are from facilities or land-use activities that use, store, or generate high-risk chemicals. High-risk chemicals are defined as chemicals listed by USEPA as having either a maximum-contaminant level or a secondary maximum-contaminant level goal for drinking water.
Not all facilities or potential sources of contamination in the SWA need be inventoried. Inventoried areas are limited to a sub-set of the entire watershed, focusing on the highest risk areas identified through the delineation of a critical assessment zone (CAZ), and susceptible area.
After the contaminant-source inventory is complete, communities are encouraged by MDEQ and USEPA to develop a management plan to protect the public-water supply. In this process, sources that pose little threat to the public-water supply can be screened out. For example, if business activities are conducted in ways that already have a low likelihood of contaminant release, a facility would not need to re-evaluate its activities. The purpose of developing a management plan based on inventory results is to address business and land-use activities that pose risks to a public-water supply. Some examples, which show the relation among potential sources of contamination and types of contaminants, are available online at http://www.wrd.state.or.us/index.shtml.
Contaminant-Source Inventory Procedure
Land-use and ownership maps are created for each SWA to provide a structure for the contaminant-source inventory. Mapping land-use and ownership allows the delineated area to be divided into four broad land-use categories: urban or built-up; agricultural, range, or forest; water or wetland; and barren.
Maps at the watershed scale allow accurate plotting of each potential source within the SWA. The land-use map, coupled with the locations of potential contaminant sources, soils, transportation, and drains, for example, assists in identifying threats from current land uses to the quality of the water supply. Sources of information for this map include available Statewide GIS layers and a community's zoning map or current land use map, which identifies specific land uses, including residential, commercial, and industrial. County and city transportation, planning, and public works departments, and chambers of commerce, are contacted to locate the best available land-use map(s) for each source-water area. These maps then are used in conjunction with the contaminant-source map to identify land uses and potential contaminant sources that pose the greatest risk to the SWA. If a zoning map is not available, aerial photos also may be useful for dividing the SWA into the broad land-use categories given above.
Federal (United States and Canada), State and Provincial, and local databases are searched for contaminant-source data that may be available for each SWA. Databases from various government levels may contain information and (or) available permits related to water quality, underground injection, hazardous waste, solid waste, underground storage tanks, air quality, water-supply wells, toxic release inventories, water rights, irrigated areas, and pesticide records. Sweat and others (2000) list databases that may provide information about potential sources of contamination within a SWA.
To supplement the database information, public water-supply officials, planners, and interested citizens are contacted. At the local level, a substantial amount of information on historical, current, or future potential contamination sources are available in the form of routine records or documents in county or city files. Local citizens also have knowledge of potential sources that are not listed elsewhere in databases or on maps. Some specific sources of information for local data on land uses and activities may include: planning departments; public works; chambers of commerce; city or county permit files; health departments; business licenses; and aerial photos.
When identifying land-use, current, historical, and intended uses of the land are considered. Historical land-uses often have an effect on present water quality. For example, on land that was used for agricultural purposes, it is necessary to identify chemicals, such as regulated pesticides, that are used, stored, or disposed of on-site. Former gasoline stations and dumpsites are considered potential risks to ground water. Searching records and (or) interviewing long-time residents can identify past sources of contamination that might otherwise be overlooked.
Aerial photographs can be helpful in identifying both present and historic land uses. Aerial photos may be available from the county seat or transportation officials. They also can be obtained from the Corps of Engineers, Natural Resources Conservation Service, local flood control districts, or from commercial aerial photographers. Other resources for aerial photographs include colleges and universities. For example, the Center for Remote Sensing at Michigan State University has an extensive collection of aerial photos in their photogrammetric library of most of Michigan that can be used to identify changes in land use.
To identify potential sources of contamination, MDEQ developed a comprehensive inventory form to ensure a consistent assessment approach. The inventory form is available on MDEQ's Web site at http://www.michigan.gov/documents/DEQ-swap99_4707_7.pdf. This form, along with maps showing land use, potential contaminant sources, and location of the water-supply intake, is sent to officials of each water supply with a request to verify and complete the inventory at the local level. Because there are variations in land uses and activities across the State, especially in agricultural areas, the list of potential sources of contamination can be adapted, based upon the completed inventory form, to apply more adequately to each supply.
The level of field reconnaissance will depend on the complexity of land use and potential contaminant sources within the SWA, and the size of the SWA. In some cases, USGS and MDEQ staff can perform the entire inventory with local community assistance without the need for any fieldwork. However, it may be necessary to conduct an in-depth survey for more densely developed areas, where GIS mapping may not be sufficient to identify individual potential contaminant sources. This survey would include driving through portions of the SWA and noting any unreported potential contaminant sources. The survey also would use GPS to field check the locations of potential contaminant sources identified during the previous data collection.
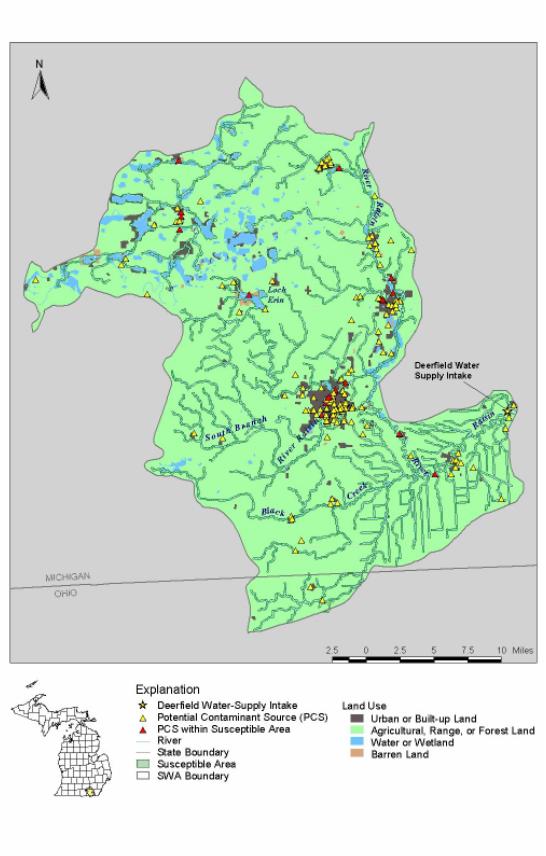
Once the potential contaminant inventory process is completed, potential contaminant sources that are within the susceptible area, and, thus, pose the greatest threat to the water supply, are identified. Identifying high-risk threats provides input for developing a protection strategy based on prioritized areas or individual sources. The contaminant source inventory provides a map showing the location of potential contaminant sources in the SWA, and a complete list of potential contaminant sources by type. An example of a contaminant source inventory is shown on figure 8. A typical summary of PCS, by type, for the Alpena WTP is shown in table 3.
Table 3. – Types of potential contaminant sources in the SWA for the Alpena WTP
| Type of potential contaminant source | Number of potential contaminant sources | Number of potential contaminant sources in the susceptible area |
|---|---|---|
| Hazardous or Solid Waste Site | 72 | 10 |
| Industrial Facilities Discharge Site | 7 | 7 |
| National Priority List Sites | 1 | 0 |
| Permit Compliance System | 9 | 3 |
| Toxic Release Inventory | 5 | 1 |
The overall success of each assessment depends upon identifying potential contaminant sources to water supplies so that communities can identify tools to reduce risks from these sources. As communities move into planning how to protect their public-water supply (source-water protection), they may want to re-visit high-risk activities and land-use areas and conduct a more in-depth assessment.
Figure 8. – Contaminant source inventory map for the Deerfield water supply
For purposes of the source-water-assessment program, MDEQ defines susceptibility determination as the potential for a public water-supply to draw water contaminated by inventoried sources within their SWA at concentrations that would pose concern (Brogren, 1999). The susceptibility determination is designed to be a relative comparison among potential contaminant sources within the SWA. The objective is to provide meaningful assessment results to public water-supplies and communities. This objective is accomplished by providing a map of the CAZ, and a map and table of potential contaminant sources identified within the CAZ of each SWA. These maps become the basis for prioritizing efforts to protect each supply's drinking-water source area.
Data collected during the delineation and inventory can be used by a community to develop a management strategy to protect the community's drinking water supply. The susceptibility analysis provides tools to help MDEQ and communities develop protection plans with management efforts directed at high and moderate risks in the most susceptible areas, with low-risk areas at a lesser priority.
Susceptible areas are zones where potential contaminant sources or land-use activities have the greatest potential to affect a water supply. Factors such as location of potential contaminant sources with respect to hydrologic features, soil permeability, and land-use within the SWA are considered when designating susceptible areas in the watershed. It is important to note that some factors may be limited by available data or require additional research. Examples of factors considered in determining susceptible areas are given in table 4.
Susceptible areas are determined for each SWA. Data collection for determining the susceptible areas within the SWA is done as part of the delineation of the SWA. After susceptible areas within a SWA are identified, maps are generated of the locations of potential contaminant sources, determined during the inventory, to be within the susceptible area (fig 8). Potential contaminant sources that fall within susceptible areas are identified from public databases. Maps of the combined susceptible areas and PCS provide communities with information that can be used to prioritize and tailor management strategies to address PCS.
Susceptibility Determination Results
Susceptibility determinations provide an estimate of the risk or sensitivity of a drinking-water supply to contamination within the CAZ and susceptible area. The susceptibility determination illustrates potential threats to a community's drinking water, and assists communities in prioritizing their efforts to protect their drinking-water supply. Examples of final susceptibility maps for completed assessments are given in figures 3, 5, 6, and 8.
Table 4. – Factors considered in determining susceptible areas
| Factor | Contamination Risk | Example | Data Source |
|---|---|---|---|
| Highly erodible soils | Turbidity, contaminated sediments | Low percent clay soils, steep slopes, developed areas | Soil survey maps, digital elevation models, digital topographic maps, assistance from forest/agricultural agencies |
| Rapidly permeable soils | Rapid transport of contaminants into surface through ground-water discharge | Recent alluvial deposits, high percent sandy soils | Soil-survey maps, digital elevation models, land-use maps |
| Critical Assessment Zone | Shoreline effect, contamination from runoff or direct discharge | Shallow or near-shore intake, storm drains adjacent to intake | Water-supply operator, drain commission, road commission |
| Susceptible area adjacent to stream | Runoff, direct discharge from land uses | Lawns or pastures abutting stream, development along shore | Land-use maps, extension service, water-supply operator |
| Susceptible area adjacent to reservoirs and lakes | Runoff, direct discharge from land uses | Lawns or pastures abutting stream, recreational use, shipping | Land-use maps, parks/recreation department, Coast Guard |
| High rainfall or irrigation areas | Runoff, turbidity, contaminated sediments, direct discharge | Tillable land abutting shoreline, storm drains | NOAA, NRCS/MDA, extension service, local databases |
CONTENTS OF SOURCE-WATER ASSESSMENT REPORT
The SDWA Amendments require that source water assessments be made available to each public water-supply, and by each supply to their customers, after assessments are completed. Assessment results, known as the "Source-Water Assessment Report" for each public water-supply, contain the following:
- Map of the SWA
- Results of sensitivity determination shown on map
- List of PCS, and locations of PCS shown on map
- Results of susceptibility determination shown on SWA land-use map
- Narrative of procedures for conducting assessment
Public-water supplies are provided with copies of the completed assessment for their supply after MDEQ and USGS conduct the assessment, and are responsible for notifying customers of assessment results.
Making Assessments Available to the Public
Assessments result in a compilation of hydrogeologic and locational databases that are useful to public-water supply officials, community planners, State agencies, and others. Source-water assessment reports, informational brochures, and Web sites with links to data provided in the assessments are available to the public. Public-water supply operators can select from a variety of methods to inform the public of assessment results, and are encouraged to include the results in their Consumer Confidence Reports, or CCR. Copies of complete source-water assessments are available to the public through public water-supplies and MDEQ offices.
Drinking-water protection databases developed as part of each assessment serves a variety of informational needs. The databases store latitude and longitude coordinates and accuracy information for surface-water intakes for delineation and assessment purposes, and link with other GIS databases for mapping and analysis. Sources of contaminants and data-collection methods are stored for each completed source-water assessment. As assessments are completed for each public water-supply, the databases provide an indication of the status of each source-water assessment in Michigan. The databases also support the sharing of information on the Internet, GIS mapping activities, and data analysis. Source-water assessment results include database tables that link to delineated SWAs.
Public-water supply officials and the public have online access to these assessments, where queries can be performed on specific information. Individuals can access a specific water supply by name, by stepping through a Web-based application and identifying a county, community, or watershed from State, county, or watershed maps. It also is possible to view the SWA for the water supply of choice on topographic, soils, land use, or other base maps. Text provides brief explanations of the meaning of each map. Data files provide additional information about the drinking-water source; for example, the length or depth of the intake pipeline, the source name, or the most recent water-quality sampling results. The locations of potential contaminant sources are available in map form to overlay each SWA map. Information in the databases is updated, as needed.
The 1996 Amendments to the SDWA require public water-supplies serving 1,000 connections or more to include notification of the source-water assessment results in their Consumer Confidence Reports, or CCR. Notification about the availability of assessment results for smaller public water-supplies may best be made by a statement on water bills or other methods that includes notification that the assessment has been completed, and information on where a complete copy of the assessment may be found.
Integration with Other Ongoing Water Quality Programs
Clean Water Action Plan: In February 1998, the USEPA and U.S. Department of Agriculture issued a Clean Water Action Plan (CWAP) that provides a strategy for restoring and protecting the Nation's water resources. One of the key elements of the CWAP requires States and Tribal governments to work with agencies, governments, and the public to assess the condition of the Nation's water resources and to prioritize watersheds for restoration. Completed assessments and prioritization efforts, developed with extensive public input, are to be used. Michigan's water-resources restoration priorities will be reviewed annually and updated as needed to reflect changing conditions and more detailed watershed information. The priorities will be used to help target increased funding associated with the CWAP and to identify where collaborative restoration opportunities are present. Source-water assessments provide a starting point for restoration and protection activities called for under the CWAP.
Michigan's Clean Water Act Section 303(d) List: Section 303(d) of the Clean Water Act requires each State to develop a list of water bodies that do not meet standards that protect beneficial uses such as drinking water, cold water fisheries, industrial water supply, recreation, and agricultural uses. MDEQ must monitor water quality and review available data and information to determine if the standards are being met. MDEQ must submit an updated list to USEPA every 2 years. The list provides a way for the public to identify problems, to develop and implement watershed-recovery plans, and for the protection of beneficial uses of the State's water resources, while achieving Federal and State water-quality standards.
Federal law requires that streams, rivers, lakes, and estuaries that appear on the 303(d) list must be managed to meet State water-quality standards. In most cases, rivers and streams receive discharges from both point sources of pollution, and from surface runoff, also known as non-point pollution. MDEQ's watershed approach for restoring and protecting water quality includes developing TMDLs for both point and non-point sources. When developing a TMDL, pollution from all sources in the watershed will be taken into account, and limits will be calculated for each pollutant entering a water body.
Management plans to restore streams and rivers to water-quality standards will be developed in cooperation with landowners and other agencies. In implementing the SWAP, MDEQ will seek to identify all public water-supply intakes so that beneficial uses of drinking water can be taken into account as TMDL work progresses. Completed source-water assessments provide a foundation on which to develop 303(d) management plans.
Pilot assessments have been completed for the Alpena, St. Joseph, L'Anse, Adrian, Blissfield, Deerfield, Detroit–Belle Isle, Mt. Clemens, and Marine City water supplies. The Alpena assessment has been reviewed by MDEQ, submitted to both the water supply and the Alpena City Council, and accepted by both. The remaining pilot assessments are being reviewed by the respective water supplies and (or) MDEQ before final edits and submission for acceptance.
The source water area for the Alpena assessment includes Thunder Bay and the Thunder Bay River watershed. Analysis of raw-water quality data indicates that under certain wind, precipitation, and (or) runoff conditions, water from the Thunder Bay River could affect the intake. In addition, storm sewers that discharge to Thunder Bay near the intake have the potential to affect raw-water quality.
Completed assessments for other pilot water supplies indicated a wide variety of potential influences on raw-water quality. The Adrian, Blissfield, and Deerfield water supplies all are potentially affected by agricultural practices upstream of their intakes. Detroit-Belle Isle and Marine City potentially are affected by shipping in the Detroit and St. Clair rivers, respectively. Mt. Clemens potentially is affected by atmospheric conditions, water levels, and recreational water uses. St. Joseph is susceptible to effects from the St. Joseph River under certain atmospheric conditions, and susceptible to seasonal water-quality fluctuations. The L'Anse supply is susceptible to water-quality changes from recreational and sport uses of the source water, and from occasional runoff induced turbidity from the Falls River and Little Linden Creek. All assessed supplies potentially are affected by permitted industrial discharges and waste-handling practices in their respective source-water areas.
The source-water assessment program for the evaluation and protection of surface-water supplies in Michigan provides information to water-supply personnel and community planners that is useful in planning for future operating practices of each supply. MDEQ has expanded and modified its present USEPA-approved, ground-water-based drinking water protection program to include surface-water sources. MDEQ and USGS have developed a source-water assessment program that includes input from a technical advisory group and a citizens advisory committee to guide the process.
GIS-based methods ease the process of delineating the SWA for surface-water-supplied systems. Using GPS to confirm present surface-water intake locations ensures the SWA delineation and all subsequent processes are based on the actual intake location. The assessment process, after the delineation of the SWA boundary, includes: defining the CAZ for each intake; determining susceptible areas within the SWA; identifying and locating potential sources of contaminants within the SWA; and conducting a PCS inventory. SWA delineations and PCS inventories allow communities to develop management plans to protect the public-water supply.
Completed source-water assessments indicate the potential for public water-supplies to draw water contaminated by inventoried sources within their SWA. Susceptibility determinations link data collected during the delineation and inventory with the development of a management strategy by the community to protect its drinking-water supply. Susceptibility determinations include a map of the locations of potential sources that fall within the susceptible area, and provide an estimate of the sensitivity of a drinking-water supply within the CAZ.
In compliance with requirements of amendments to the SDWA, MDEQ and USGS are preparing assessment reports that include maps of the SWA, lists of PCS, PCS locations shown on a map, results of the susceptibility determination shown on a map, and a narrative of procedures used for conducting the assessment. These assessments are similar to those being prepared by MDEQ and communities under the wellhead protection program for ground-water supplies. In coordination with other programs such as the CWAP and Michigan's Clean Water Act, assessments allow for improved protection of surface-water-supply intakes from potential sources of contamination. Source-water assessment results are made available to each public water-supply through a number of print and electronic media.
American Water Works Association Research Foundation. (2001) Development and implementation of random-walk particle tracking analysis of water supply intakes on rivers and lakes: A case study of St. Clair-Detroit River waterway (2743), accessed online at http://www.awwarf.org/research/TopicsAndProjects/abstract.aspx?pn=2743, last accessed September 2001.
Brogren, B.B. (1999) State of Michigan Source-water Assessment Program: Michigan Department of Environmental Quality, final version as approved by USEPA, 153 p; also online at http://www.michigan.gov/documents/DEQ-swap99_4707_7.pdf, last accessed September 2001.
Holtschlag, D.J. and Brogren, B.B. (2000) A two-dimensional, transient flow model of the St. Clair-Detroit River waterway: U.S. Geological Survey Fact Sheet, unnumbered, February 2000, accessed online at http://mi.water.usgs.gov/progproj/mi08900.html, last accessed September 2001.
Lanier, T.H. and Falls, W.F. (1999) Methods for segmentation of source-water protection areas and susceptibility assessment to contamination for public surface-water systems, and their application to an intake, Aiken, South Carolina, in Hatcher, K.J., ed. Proceedings of the 1999 Georgia Water Resources Conference, March 30-31, 1999, University of Georgia.
Oregon Department of Environmental Quality and Oregon Health Division. (1999) Source-water assessment plan: Implementation of the Safe Drinking Water Act 1996 Amendments: Oregon's drinking water protection program, http://www.deq.state.or.us/wq/dwp/swapcover.htm, accessed 27 August, 2001.
Sweat, M.J., Erickson, P.M, and Brogren, B.B. (2000) The Michigan source-water assessment program for evaluation of public surface-water supplies, in, Proceedings of the NWQMC National Monitoring Conference-Monitoring for the Millennium, National Water Quality Monitoring Council, April 25-27, 2000, Austin, TX, pp. 515-528.
United States Department of Agriculture, variably dated, Soil surveys of Michigan counties: Soil Conservation Service soil survey reports, pagination varies. U.S. Environmental Protection Agency. (1997a) State methods for delineating source-water protection areas for surface-water supplied sources of drinking water. EPA 816-R-97-008, variably paginated.
----- (1997b) State source-water assessment and protection programs guidance: Final guidance. EPA 816-R-97-009, variably paginated.
----- (1998) Better assessment science integrating point and nonpoint sources: BASINS Version 2.0, EPA 823-B-98-006, variably paginated.