Water Resources of Michigan
Simulated Effects of Pumping Irrigation Wells on Ground-Water Levels in Western Saginaw County, Michigan
US Geological Survey Water-Resources Investigation 01-4227
Lansing, Michigan 2001
By: C.J. Hoard and D.B. Westjohn
Accessible Web version is available in Web (HTML) format at:
http://mi.water.usgs.gov/WRIR/WRIR01-4227/WRIR01-4227LW.php
Contents
U.S. DEPARTMENT OF THE INTERIOR
GALE A. NORTON, Secretary
U.S. GEOLOGICAL SURVEY
Charles G. Groat, Director |
Prepared in cooperation with the Michigan Department of Environmental
Quality |
| Any use of trade, product, or firm names in this publication
is for descriptive purposes only and does not imply endorsement by the U.S.
Government. |
Contents:
FIGURES
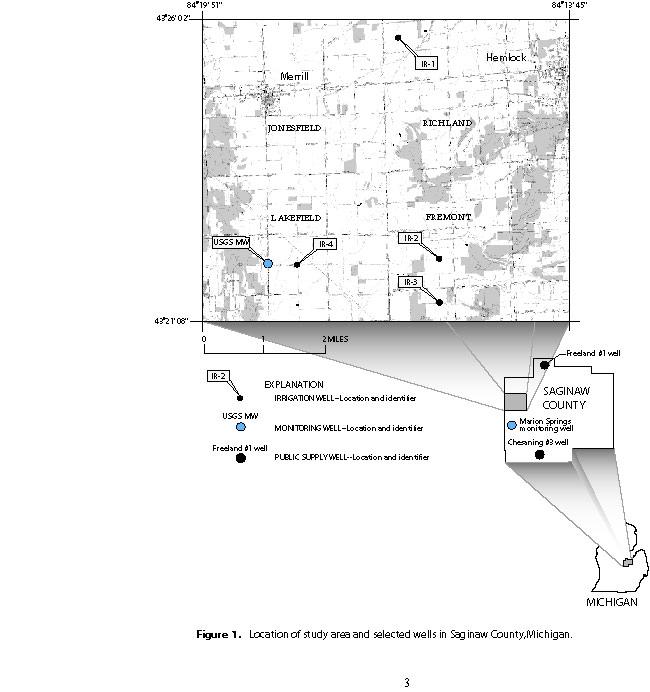
Figure 1. Location of study area and selected
wells in Saginaw County, Michigan.
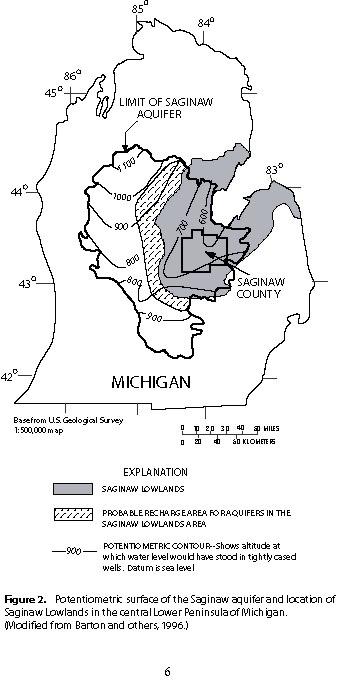
Figure 2. Potentiometric surface of the
Sainaw aquifer and location of Saginaw Lowlands in the central Lower Peninsula
of Michigan (Modified from Barton and other, 1996.).
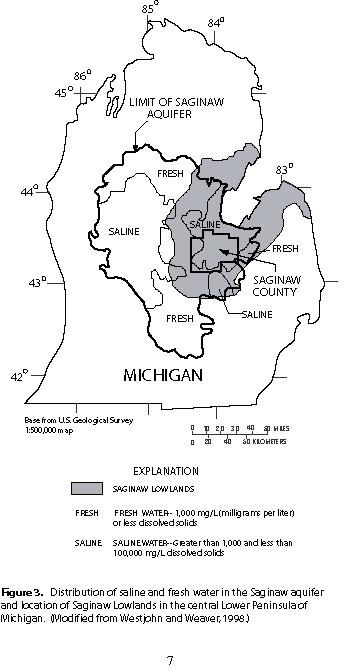
Figure 3. Distribution of saline and fresh
water in the Saginaw aquifer and locatio of Saginaw Lowlands in the central
Lower Peninsula of Michigan (Modified from Westjohn and Weaver, 1998.)
Figure 4. Increase of chloride concentration
as a function of time at two public-supply wells in western Saginaw County,
Michigan.
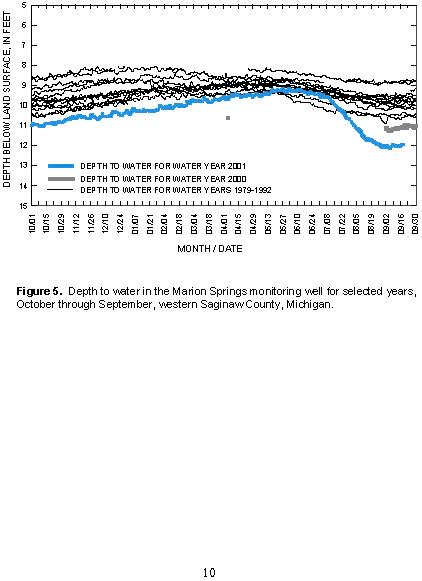
Figure 5. Depth to water in the Marion Springs
monitoring well for selected years, October through September, western Saginaw
County, Michigan.
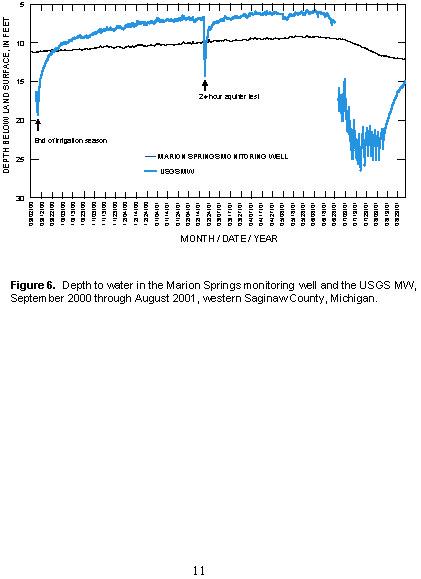
Figure 6. Depth to water in the Marion Springs
monitoring well and the USGS MW, September 2000 through August 2001, western
Saginaw County, Michigan.
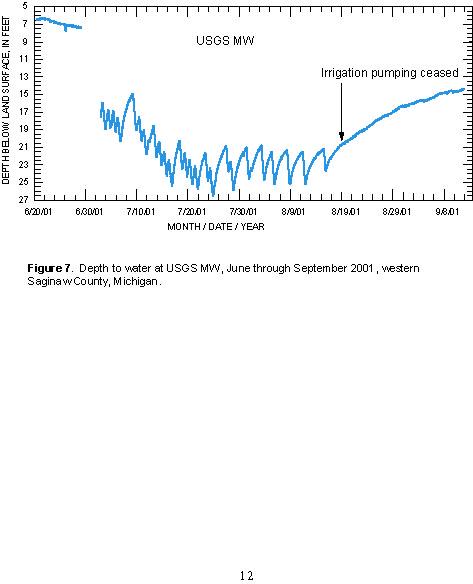
Figure 7. Depth to water at USGS MW, June
throught September 2001, western Saginaw County, Michigan.
Figure 8. Example of model discretization
for axisymmetric flow simulations. (From Reilly and Harbaugh, 1993.)
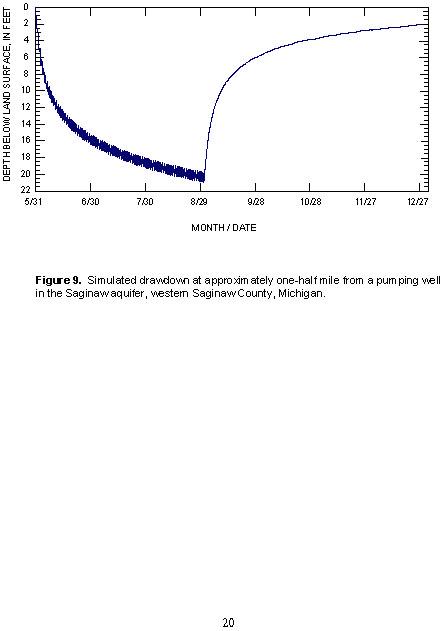
Figure 9. Simulated drawdown at approximately
one-half mile from a pumping well in the Saginaw aquifer, western Saginaw County,
Michigan.
Figure 10. Simulated drawdown at different
distances from a single irrigation well after 3 months pumping with a 12-hour
pumping cycle, western Saginaw County, Michigan.
Tables
Table 1. Well location, pumping rate,
and aquifer for irrigation wells used for model calibration
Table 2. Model parameters used for simulations
Table 3. Simulated drawdown compared
to observed drawdown used for model calibration
Table 4. Summary of predicted drawdown
after one month and three months of pumping, at selected distances
Table 5. Factors that can contribute
to insufficient water supply at residential wells
Conversion Factors, Vertical Datum, and Abbreviations
For use of readers who prefer the International System of Units (SI), the conversion
factors for terms used in this report are listed below.
| Multiply |
By |
To obtain |
| inch (in.) |
2.54 |
centimeter |
| foot (ft) |
0.3048 |
meter |
| mile (mi) |
1.609 |
kilometer |
| square mile (mi2) |
2.59 |
square kilometer |
| foot per day (ft/d) |
0.3048 |
meter per day |
Sea level: In this report "sea level" refers to National Geodetic
Vertical Datum of 1929 (NGVD of 1929), a geodetic datum derived from a general
adjustment of the first-order level nets of both the United States and Canada,
called Mean Sea Level of 1929.
Glossary
- Aquifer
- A water-bearing unit of rock or sediment that will yield water in a usable
quantity to a well or spring.
- Basal lodgment till
- A mixture of unsorted sediments (in this case mostly clay) plastered directly
on land surface by overriding glacial ice.
- Bedrock
- A general term for consolidated (indurated) rock that underlies soils or
other unconsolidated surficial material.
- Confining unit
- A layer of rock or sediment having very-low hydraulic conductivity that
impedes the movement of water into and out of an aquifer.
- Drawdown
- The reduction in water level at a point caused by the withdrawal of water
from an aquifer. For this report, water-level declines caused by pumping of
a well.
- Glaciofluvial
- Material moved by glaciers and subsequently sorted and deposited by streams
or overland flow of water from melting ice.
- Ground-water gradient
- Change in water level per unit distance measured in the direction of the
steepest change.
- Hydraulic conductivity
- The capacity of a rock or sediment to transmit water. It is expressed as
the volume of water at the existing kinematic viscosity that will move in
unit time under a unit ground-water gradient through a unit area measured
at right angles to flow.
- Lacustrine sediment
- Stratified materials deposited in ponded or still-standing water, usually
fine grained (typically silt to clay) due to low-energy nature of sedimentary
environments.
- Recharge
- Inflow of water to a ground-water reservoir from the surface. Infiltration
of precipitation and its movement to the water table is one form of natural
recharge. Also, the volume of water added by this process.
- Storage coefficient
- The volume of water released from storage in a unit volume of aquifer when
the head is lowered a unit distance.
For additional information
write to:
District Chief
U.S. Geological Survey, WRD
6520 Mercantile Way, Suite 5
Lansing, MI 48911-5991
|
Copies of this report can be
purchased from:
U.S. Geological Survey
Branch of Information Services
Box 25286
Denver, CO 80225-0286
|
Citation:
Back to Main
Publications List
Back to USGS, WRD Michigan Home Page
