
Open-File Report 01-17
by David J. Holtschlag and Steve S. Aichele
|
U.S. Geological Survey
6520 Mercantile Way, Suite 5 Lansing, MI 48911-5991 Internet: dholtschlag@usgs.gov saichele@usgs.gov Phone: (517) 887-8910 (517) 887-8918 FAX: (517) 887-8937
|
Table of Contents
Abstract
St. Clair River is a connecting channel of the Great Lakes between Lake Huron and Lake St. Clair. The river forms part of the international boundary between the United States and Canada in the eastern Lower Peninsula of Michigan and southern Ontario. Drifting buoys were deployed to help investigate flow characteristics near public water intakes in ten reaches of St. Clair River from October 3-5, 2000. In eight deployments, buoys were released at uniform intervals in a transect across the river to better understand flow patterns. In the remaining six deployments, buoys were released in a cluster near the middle of the channel to study turbulent dispersion characteristics. The eight spherical and seven cylindrical buoys used in the study were equipped with drogues and had similar drift characteristics. Each buoy contained a geographical positioning system (GPS) to monitor its movement. Computer animations were developed that integrated these GPS data with data shown on navigational charts. These computer animations, which can be viewed through the Internet, provide a scientific visualization tool to study the deployments.
Introduction
Michigan Department of Environmental Quality (MDEQ) Source Water Assessment Program (SWAP), in cooperation the U.S. Geological Survey (USGS), is assessing the vulnerability of 13 public water supplies along the St. Clair-Detroit River Waterway. Intakes in this area provide water to about one third of the residents of Michigan. The assessment will identify likely sources of water to public supply intakes and provide a basis for planning emergency responses to contaminant spills. Drifting buoy deployments described in this report were conducted as part of this assessment to better understand flow patterns and turbulent dispersion characteristics in St. Clair River.
Location
St. Clair River is a connecting channel between Lake Huron and Lake St. Clair that forms part of the international boundary between the United States and Canada (fig. 1). In addition to being a major commercial navigation route through the Great Lakes, the river provides a water supply for adjacent communities. Port Huron, Marysville, St. Clair, Marine City, and Algonac, Michigan, in addition to communities in the Canadian province of Ontario, have water intakes on St. Clair River.
![]()
Figure 1. Location of St. Clair River between the United States and
Canada.
St. Clair River extends about 39 miles from its head at the outlet of Lake Huron to its mouth on Lake St. Clair. The river discharges an average of 182,000 ft3/s (cubic feet per second) from a drainage area of about 222,400 mi2 (square miles). Within the river, water surface elevations fall about 5 ft (feet), much of which occurs in the upper reaches of the river. Model simulations show that average flow velocities range from about 5.76 ft/s (feet per second) near Port Huron, Michigan during high flow conditions to about 1.84 ft/s near Algonac, Michigan during low-flow conditions (Coordinating Committee on Great Lakes Hydraulic and Hydrologic Data, 1986).
Purpose and Scope
Drifting buoys, which carried geographical positioning systems (GPS), were deployed to help describe flow patterns and turbulent dispersion characteristics within selected reaches of St. Clair River. Computer animations showing the generalized buoy movements during these deployments were developed to aid visualization of the results. Flow and stage data are provided as supporting information. Further analysis and interpretation of these data is needed to quantify hydraulic properties of the river for the vulnerability analysis.
Previous Investigation
The Detroit District of the U.S. Army Corps of Engineers (1983) conducted a drifting buoy study of St. Clair River in May and June of 1982. In this study, drifting buoy movements were monitored from the air. Detailed plots provide quantitative surface-current velocity data throughout the river and graphs of wind velocity. The study enhances emergency preparedness by providing detailed information on local flow patterns, thus facilitating the prediction of constituent transport.
Acknowledgements
The study was made possible by funding from the Michigan Department of Environmental Quality (MDEQ), Source Water Assessment Program (SWAP). Brad Brogren of MDEQ assisted with the field deployment and recovery of the buoys. Environment Canada provided the use of their research vessel, The Pelican, and the assistance of Brian Magee and Aaron Thompson to help deploy, track, and recover the buoys. Staff from the Detroit District of the U.S. Army Corps of Engineers (USACE), John Koschik, Paul Taylor, Marty Kuhn, and Phil Ross measured streamflow in St. Clair River and major tributaries during the deployments. Rick Hooper, Office of Water Quality of the USGS provided the spherical buoys, and John Costa, USGS Office of Surface Water, provided enhanced equipment for recording buoy positions. Stewart Rounds, USGS Oregon District, integrated the report text and animations to create the web version of the report.
Methods
Drifting Buoys Construction
Eight spherical and seven cylindrical buoys were deployed in St. Clair River. The spherical buoys are surface drifters that were originally designed for extended deployments in ocean environments by Clearwater Oceanographic Instrumentation. These buoys are about 16 inches in diameter and weigh about 45 pounds (fig. 2). They are equipped with telemetry to transmit positional information to satellite or hand-held receivers. For St. Clair River deployments, the electronics of these buoys were enhanced to decrease the sampling interval from 30 minutes to about 90 seconds and to increase the precision of positional information from about 700 ft to about 70 ft. Local interferences, however, often reduced the average sampling intervals to more than 180 seconds. One of the spherical buoys was enhanced to internally record data at one-second intervals.
![]()
Figure 2. Spherical buoy and plastic bucket drogue used in the
drifting buoy deployments on St. Clair River.
The cylindrical buoys were constructed by joining a 9-inch length of 3-inch diameter PVC (polyvinyl chloride) pipe with a 36-inch length of 4-inch diameter PVC pipe (fig 3). The 3-inch diameter pipe floated above the waterline (fig. 4) and contained a Garmin GPS 12 unit that was set to internally record positional information at 45-second intervals. The specified positional accuracy of the Garmin GPS units, during the period of the Selective Availability Program, was 49 ft (Garmin Corporation, 1999). The 4-inch diameter part of the cylindrical buoys provided buoyancy. The lower end of the buoy was weighted to help provide a vertical orientation when deployed.
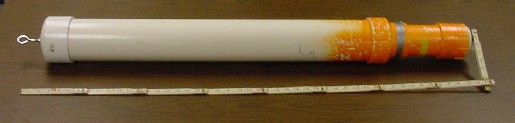
Figure 3. Cylindrical buoy used in deployments on St. Clair River.
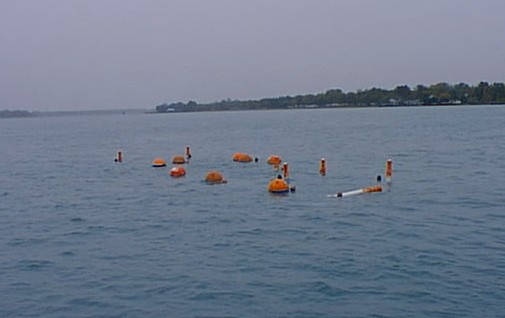
Figure 4. Spherical and cylindrical buoys drifting in St. Clair
River.
The U.S. Department of Defense Selective Availability Program had been discontinued before these buoy deployments. Thus, the accuracy of the positional information is considered constant throughout the deployments. In some deployments, positional data was not transmitted or recorded from one or more buoys with sufficient frequency to include in the animations.
All buoys were equipped with drogues to reduce the effects of wind on buoy movements. Drogues were made from 5-gallon plastic buckets that were suspended about 3 feet below the bottom of the buoys. Holes were cut in the bottom of the buckets to allow drainage and facilitate buoy recovery. The drogues were weighted so that they remained suspended below the buoys. Floats were attached to the buoys to facilitate recovery.
Buoy Deployments
Fourteen buoy deployments were used to investigate flow characteristics in ten reaches of St. Clair River. Deployments generally lasted about 1 hour. During all deployments, winds were generally light to calm (under 10 miles per hour) and wave heights were generally less than one foot. Thus, winds and waves are not thought to significantly impact buoy movements during these deployments.In eight of the deployments, buoys were distributed at about equal distances in a transect across the river. In these transect deployments, spherical and cylindrical buoys were generally released alternately. The transect deployments were used to investigate flow patterns and relative velocities within the reach.
In the remaining six deployments, buoys were released in a tightly grouped cluster near the center of the channel. The cluster deployments were used to investigate the turbulent dispersion characteristics of the reach.
Ancillary Data
Streamflow. Staff from the Detroit District of the U.S. Army Corps of Engineers measured streamflow on St. Clair River and selected tributaries by use of an acoustic Doppler current profiler (Table 1). Streamflow during the buoy deployments was generally lower than average.
Table 1. Streamflow measurements during buoy deployments on St. Clair
River. [Measurements were taken by the Detroit District of the U.S. Army
Corps of Engineers.]
Stage. Water surface elevation (stage) is recorded at 6-minute intervals at six National Oceanic and Atmospheric Administration (NOAA) gauges on St. Clair River. During the buoy deployments, average water levels remained fairly constant (fig. 5). Greater variation in water levels, however, was detected at upstream gauges than downstream gauges. Specifically, the standard deviation of water levels ranged from 0.12 foot at the Fort Gratiot gauge compared to a standard deviation of 0.05 foot at the Algonac gauge.
Figure 5. Water level fluctuations along St. Clair River during
buoy deployments.
Animation Techniques
Buoy animations were developed by use of LiveMotion®, a software product of Adobe Corporation. All animations represent one minute of actual deployment time as one second of animation time. Background maps for the animations were scanned from 1:15,000 scale maps (National Oceanic and Atmospheric Administration, 1999), which show contour and point depths of flow in feet below low-water datum. The pixel coordinates of the scanned images were registered with positional information on the maps to facilitate plotting of measured buoy locations. Buoy locations were generally included at about 90-second intervals, when GPS data was available. Between measured locations, buoy positions were automatically interpolated by use of a Bezier curve. Pairs of Macromedia Flash file format (SWF) and hypertext markup language (html) files were created to display the animations through the Internet. A Flash file reader plug in for standard Internet browsers is available without charge from Macromedia.
Results
Data on buoy deployments were animated to help visualize the flow pattern and turbulent dispersion characteristics near public water intakes on St. Clair River. Figure 6 shows the locations of the drifter studies, with links to the animations.
![]()
Figure 6. Location of drifter studies on St. Clair River near Port
Huron, Michigan.
The drifter animations also may be accessed from the following list:
-
Blue Water Bridge Transect [240 Kb]
-
Blue Water Bridge Cluster [237 Kb]
-
Port Huron, Michigan and Sarnia, Ontario Transect [273 Kb]
-
Dow Chemical of Canada Transect [343 Kb]
-
Marysville, Michigan Transect [262 Kb]
-
Stag Island East Transect [297 Kb]
-
St. Clair, Michigan Transect [437 Kb]
-
Detroit Edison of Michigan Transect [239 Kb]
-
Detroit Edison of Michigan Cluster [257 Kb]
-
Marine City, Michigan Cluster [371 Kb]
-
Port Lambton, Ontario Cluster [415 Kb]
-
Algonac, Michigan Transect [270 Kb]
Summary
The Michigan Department of Natural Resources, in cooperation with the U.S. Geological Survey, is conducting a source water assessment of public water supply intakes on St. Clair River. As part of this assessment, 14 deployments of drifting buoys were used to investigate flow patterns and turbulent dispersion characteristics in ten reaches of St. Clair River from October 3-5, 2000. As many as eight spherical and seven cylindrical drifting buoys were used in each deployment. The spherical buoys transmitted identification, time, and position information as frequently as every 90 seconds to a receiver carried aboard the Environment Canada research vessel the Pelican. The cylindrical buoys carried a handheld GPS device that stored time and positional information at 45-second intervals. Data on buoy movements during the deployments were animated and referenced to a navigational chart to help visualize the results. The animations are available through the Internet to those interested in the flow characteristics of St. Clair River.