
Proposed changes to watershed management practices near C-3 Pool at Seney National Wildlife Refuge will affect surface-water flow patterns, ground-water levels, and possibly local plant communities. Data were collected between fall 1998 and spring 2000 to document existing conditions and to assess potential changes in hydrology that might occur as a consequence of modifications to water management practices in C-3 watershed.
Minimum and maximum measured inflows and outflows for the study period are presented in light of proposed management changes to C-3 watershed. Streamflows ranged from 0 to 8.61 cubic meters per second. Low or zero flow was generally measured in late summer and early fall, and highest flows were measured during spring runoff and winter rain events. Ground-water levels varied by about a half meter, with levels closest to or above the land surface during spring runoff into the early summer, and with levels generally below land surface during late fall into early winter.
A series of optional management practices that could conserve and restore habitat of the C-3 watershed is described. Modifications to the existing system of a drainage ditch and control structures are examined, as are the possibilities of reconnecting streams to their historical channels and the construction of additional or larger control structures to further manage the distribution of water in the watershed. The options considered could reduce erosion, restore presettlement streamflow conditions, and modify the ground-water gradient.
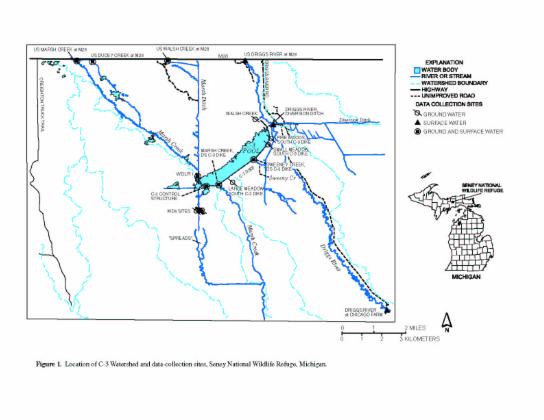
In the early 1900's, attempts were made to establish agriculture throughout the Seney area. Land was cleared by timber harvesting and then burning. Land speculators dug ditches to drain the area for agricultural uses. These efforts failed to produce a viable agricultural economy, and early settlers abandoned the lands. In 1935, Congress established Seney National Wildlife Refuge (NWR) for the protection and production of migratory birds and wildlife (fig. 1). Between 1935 and 1942, a series of dikes were constructed to impound water for use by migratory waterfowl. Long-term damage to the Refuge has resulted from the discharge of spring runoff via Walsh Ditch, including erosion of peat and sand in the area south of C-3 Pool. One area of particularly severe erosion, known as the "spreads," is an area where water flow has abandoned Walsh Ditch. There has been a regional increase of the water table altitude and potentiometric surface altitude near C-3 Dike and Pool, and a general decrease of the water table altitude and potentiometric surface altitude downgradient of C-3 Dike and Pool. These water level changes have caused changes in native plant communities (Kowalski, 2000; Michael Tansy, U.S. Fish and Wildlife Service, Seney National Wildlife Refuge, oral commun., 2000).
Human activity has affected flow in Marsh Creek since about 1900. Walsh Ditch first intercepted flow from Marsh Creek in the early 1900's. Local ground-water discharge likely maintained some flow in the channel downstream of Walsh Ditch until the 1940's. Construction of C-3 Dike began in 1935 to form an impoundment for use by migratory waterfowl. With the construction of the dike, flow in the Marsh Creek channel below C-3 Dike and Pool likely diminished to only seasonal flows from ground-water discharge, precipitation, and snowmelt. In order to adequately design modifications to C-3 Dike to manage the flow of water through wetlands downstream from C-3 Dike, information is needed about the amount of water flowing through C-3 watershed, both upstream and downstream from C-3 Dike. The U.S. Geological Survey (USGS), in cooperation with the U.S. Fish and Wildlife Service, investigated the relation between surface water and ground water, and the management of surface-water inflows and outflows, to obtain information needed to determine the optimum management of water flows into and out of C-3 watershed. This information is necessary to help guide management and restoration activities. Specifically, the data will aid in evaluating the effects of restoring flow to historical Marsh Creek and Walsh Creek channels and in evaluating the effects of diminished flows in Walsh Ditch. They also will aid in determining optimal flows in Marsh Creek, Walsh Creek, and Walsh Ditch, in determining optimal diversions from Walsh Creek to both the Driggs River and to C-3 Pool, and in determining how these flow regimes might best be managed.
In 1997, a water-control structure was installed in C-3 Dike where it intersects the historical Marsh Creek channel, making possible the diversion of water from C-3 Pool into this channel. In 1998 and 1999, USGS investigators established stream-gaging sites, water-table wells, and piezometers throughout C-3 watershed to determine a water budget and to provide local hydrologic, biologic, and physical data. Samples of surface and ground water were collected and tested for physical properties and quality, including temperature, pH, alkalinity, specific conductance, and dissolved oxygen (Everett Collier, U.S. Fish and Wildlife Service, written commun., 1999, 2000; Kurt Kowalski, U.S. Geological Survey, written commun., 2000).
Figure 1. Map showing location of C-3 watershed and data collection points
In 1999 and 2000, discharge measurements were made in streams and ditches upstream
and downstream from C-3 Pool, and water levels were measured in piezometers
and wells throughout C-3 watershed to determine a preliminary water budget for
the area. Spring runoff was measured at frequent intervals to determine peak
volumes of water that could be expected during this season; however, due to
minimal snow pack and low water content of the snow pack, the data likely do
not represent maximum conditions experienced in the past.
In July 1999, water was discharged to the historical Marsh Creek channel for
2 days to determine the impact such discharges might have. Water was allowed
to flow into the channel for 48 hours, with ever-increasing volume. For about
the last 30 hours of this test, discharge was at the maximum capacity of the
control structure, approximately 0.878 cubic meters per second (cms). Evaluation
of the stream channel after the test indicated no adverse effects from these
flows (Michael Tansy, oral commun., 1999; James Ellis, U.S. Geological Survey,
and Kurt Kowalski, written and oral commun., 1999). This was the first known
flow of surface water in this channel since the construction of C-3 Dike in
the 1940's.
Beginning in August 1999, refuge managers began to use Marsh Creek as the primary discharge structure for C-3 Dike. In 2000, spring runoff (up to 0.878 cms) was routed into the historical Marsh Creek channel through the Marsh Creek control structure for the first time since its construction. The remainder of the discharge from C-3 Pool was routed first through the Sweeney Creek control structure (about 5.66 cms) and then through the Walsh Ditch control structure (about 1.42 cms), reducing the amount of discharge through Walsh Ditch by more than 7.08 cms from the previous year. Measurements of discharge through this channel were made beginning in August 1999 and continuing through spring 2000 runoff. These discharge data will allow for an assessment of the impact of discharge through the historical Marsh Creek channel, the impact on channel morphology and adjacent ground-water levels, and will provide the basis for sound scientific judgments about further modifications to the C-3 Dike and discharge structures.
Seney NWR is located in the east-central Upper Peninsula and southeastern Upper Peninsula hydrologic provinces (Rheaume, 1991), about mid-way between Lakes Superior and Michigan. Terrain slopes S75ºE at 1.1 to 1.3 meters per kilometer (Heinselman, 1965), and most of the area is covered by fens and perhaps some bogs. Surface deposits are primarily glacial deposits overlying Ordovician sandstone, limestone, and dolomite. Two thirds of the refuge is mantled by peat deposits, which range in thickness from a few centimeters to more than 2 meters. Vegetation is primarily forest and a mixture of sedges and shrubs. C-3 watershed is in the northwest corner of the Refuge and comprises approximately 1,800 hectares.
During winter, snow and ice accumulate across the contributing area for C-3 watershed, creating a potential store of surface water to be released in the spring with warmer temperatures and additional precipitation. Maximum flows into C-3 Pool occur in the spring as the snow and ice melt, typically during spring rainstorms. As flows into C-3 Pool increase, the level of the Pool rises, and eventually its maximum capacity is reached. In order to minimize erosion and the potential for failure of the C-3 Dike, excess water must be released from the Pool.
A control structure on Walsh Ditch regulates the level of C-3 Pool and regulates discharge to Walsh Ditch. A smaller control structure on Sweeney Creek controls discharge to Sweeney Creek, and augments discharge into a series of pools along the west side of the Driggs River. In 1997, a control structure was installed in C-3 Dike to allow discharge into the historical Marsh Creek channel.
Historically, excess water has been discharged to Walsh Ditch, with some water being discharged to Sweeney Creek. However, both channels are either at or over their capacity during this discharge, which has resulted in erosion and damage to the peat and underlying surfaces downstream from C-3 Pool. Before 2000, all discharge from C-3 Pool was either to Walsh Ditch and (or) to Sweeney Creek. Spring discharge was routed into Walsh Ditch and contributed to severe erosion in an area known as the "spreads", lowering the land surface, scouring, eroding, and removing the overlying peat, and eroding underlying sands. As a consequence of these processes, the water table declined by as much as 4 to 6 m. Eroded materials were transported to the Manistique River, where they were deposited on spawning areas used by various fish species (Michael Tansy, oral commun., 1997). Most discharge from C-3 Pool was routed through Walsh Ditch before 1999. After documenting erosion caused by this discharge, flows to Walsh Ditch have been limited and it is used only after the capacity of other discharge structures has been reached. Discharge to Sweeney Creek is limited to about 5.7 cms to control erosion.
The historical Marsh Creek channel downstream from C-3 Dike was blocked by the construction of C-3 Dike. Parts of the historical Marsh Creek channel immediately downstream from C-3 Dike have been maintained by seepage through the dike, ground-water discharge, and construction of beaver dams, while the middle reach has all but disappeared. The lower reach appears to have been maintained by ground-water discharge and beaver dams.
During the study period, precipitation in the study area averaged between 6.5 cm (1997) and 19.9 cm (1998) below the long-term average of 80.4 centimeters per year (National Climatic Data Center, 2000), and temperatures ranged from 0.2 degrees Celsius (ºC) (1997) below the long-term average of 5.1 ºC to more than 4.2 ºC (1998) above the long-term average. This combination of below-normal precipitation and above-normal temperatures contributed to above-normal evapotranspiration, lower than normal snow pack, lower than normal snow-moisture content, and lower than normal stream flow during the study period.
Measurements of surface-water stage and discharge were made throughout the study area to determine the amount of water flowing into and out of C-3 Pool. Water-table wells and piezometers were installed in or near each site where surface-water data were collected, and ground-water levels were measured periodically. Seasonal ground-water gradients were determined for the study area. The altitudes of ground-water and surface-water levels were compared to determine the potential for flow between the two environments.
Measurement of stream stage and discharge
In September 1998, staff gages were established at three sites upstream from C-3 Pool, at the C-3 Pool control structure on Walsh Ditch, and at three sites downstream from C-3 Pool (fig. 1). Measurements of discharge in streams flowing into, through, and out of C-3 Pool were made at both high and low flow in an attempt to quantify the amount of water available within the C-3 watershed. In 1999, seasonal discharge measurements were made at successive downstream sites on the Driggs River and at sites on Walsh Ditch and the creeks feeding into Walsh Ditch in order to quantify ground-water discharge.
Marsh, Ducey, and Walsh Creeks (fig. 1) are the principal contributors of surface water to C-3 Pool, and all are intercepted by Walsh Ditch. To quantify the amount of water entering C-3 Pool, discharge measurements were made at each of the creeks where they cross state highway M28. Between Marsh, Ducey, and Walsh Creeks are a number of small culverts that drain a roadside ditch and flow under a rail bed into the C-3 Pool contributing area. Flow through these culverts is sporadic and was quantified when possible. Flow was measured in Walsh Ditch at the most downstream point possible before it enters backwater from C-3 Pool.
Walsh Ditch, Marsh Creek, and Sweeney Creek (fig. 1) are the principal surface water outflows from C-3 Pool. Flow into each is regulated by stop logs within a control structure, either a dam or a drop pipe. Because the level of C-3 Pool is regulated, and thus the flow from C-3 Pool, there is commonly little, if any, relation between inflows and outflows on a daily, or even seasonal, basis.
Measurement of ground-water levels
Water-table wells and/or piezometers were installed at all surface-water sites, with the exception of the Driggs River, to aid in the interpretation of the relation between surface and ground water. The wells were constructed by hand augering a 6.4-cm diameter hole through the peat and continuing about 1 meter (m) into underlying sand. This was done to avoid frost heave during winter. A 5.08-cm outside-diameter plastic pipe was then assembled with a drive point at the bottom and a 20-cm screened section designed to straddle the water table as measured when the hole was augered. The hole was then back-filled with bentonite-clay grout from the bottom of the hole to just below the screen. Coarse, angular sand was then placed in the annulus to the top of the screen and bentonite clay grout was placed above the sand to land surface. Piezometers were constructed in a similar manner, except that the screened interval was only 10 cm long. Two piezometers were installed, one with its screen in peat about 10 cm above the peat-sand interface, and one with its screen in sand about 10 cm below the peat-sand interface.
Piezometers were installed at surface-water sites immediately below C-3 Pool and immediately behind the C-3 Pool control structure. Water-table wells were installed between Marsh Creek and Sweeney Creek and at three sites east of Sweeney Creek. Both a piezometer and a water-table well were installed at stream-gaging sites upstream from C-3 Pool, and at Lower Walsh Ditch downstream from C-3 Pool. In addition, nested piezometers and water-table wells were installed at the Lower Walsh Ditch site to determine any local gradients associated with Walsh Ditch.
Ground-water levels were measured approximately monthly (tables 2 and 3, appendix A), except during winter months, and whenever a surface-water discharge measurement was made. Measurements were made using an electric tape lowered from the top of the well casing to the water surface. Depth to water from the top of the casing was then converted into a water-level altitude by subtracting the depth to water from the surveyed altitude of the measuring point. In this way, ground-water altitudes could be directly compared to surface-water altitudes.
Measurements of surface-water discharge and ground-water levels
Surface-water levels, stream discharge, and ground-water levels were measured between March and December of 1999, and during spring runoff in 2000. Stream discharges ranged from zero (no flow) throughout much of the summer and early fall to more than 8.5 cms during spring runoff. Ground-water levels fluctuated throughout the period of study by a few centimeters to almost a meter.
Between 3 and 24 discharge measurements were made at 16 sites in the C-3 Pool watershed (table 1, appendix A). Flows downgradient of C-3 Pool are regulated and account for the majority of zero-discharge measurements. The highest flows were measured in the Driggs River and Walsh Creek upgradient of C-3 Pool.
Marsh Creek at M28 near Shingleton, Michigan
Thirteen discharge measurements were made at this site between September 16, 1998 and May 18, 2000 (table 1, appendix A). Discharge was measured as or observed to be zero on 3 occasions. The greatest measured discharge at this site was 0.521 cms on April 5, 1999.
Ducey Creek at M28 near Seney, Michigan
Twelve discharge measurements were made at this site between September 16, 1998 and May 18, 2000 (table 1, appendix A). Discharge was measured as or observed to be zero on 3 occasions. The greatest measured discharge at this site was 2.61 cms on April 5, 1999.
Walsh Creek at M28 near Seney, Michigan
Twelve discharge measurements were made at this site between September 17, 1998 and May 18, 2000 (table 1, appendix A). The least measured discharge was 0.046 cms on September 20, 1999. The greatest measured discharge at this site was 5.58 cms on April 5, 1999.
Miscellaneous measurements of discharge along M28
During March through May 1999, 6 culverts were monitored for flow. Measured discharge in a culvert 1.6 kilometers (km) east of Walsh Creek on April 5 was 0.680 cms. Discharge was not observed in the other culverts on April 5, although it was noted that at two of the culverts site conditions indicated that there may have been flow at an earlier time. On April 13 discharge of 0.226 cms was measured in a culvert 1.2 km east of Walsh Creek, and in the culvert 1.6 km east of Walsh Creek discharge was estimated to be between 0.028 and 0.057 cms.
Walsh Ditch upstream from C-3 Pool at Seney National Wildlife Refuge
Thirteen discharge measurements were made at this site between September 16, 1998 and May 17, 2000 (table 1, appendix A). Discharge was measured as or observed to be zero on one occasion, probably because of high water in C-3 Pool causing backwater. The greatest measured discharge at this site was 8.64 cms on April 5, 1999.
Walsh Ditch at Outlet of C-3 Pool
Fifteen discharge measurements were made at this site between September 23, 1998 and June 29, 2000 (table 1, appendix A). The lowest measured discharge was 1.13x10⁻⁴ cms on May 17, 2000. The greatest measured discharge at this site was 8.5 cms on April 6, 1999.
Through 1999, Walsh Ditch at the outlet of C-3 Pool was the primary outlet for C-3 Pool. Beginning in 2000, this was no longer the case, and the majority of discharge from C-3 Pool was sent first down Marsh, then Sweeney Creeks. Discharge from C-3 Pool in 2000 was less than in 1999, although this is most likely a function of meteorological and hydrologic conditions, not the configuration of the control structures.
In recent years, beaver have colonized Walsh Ditch, disrupting flow in the ditch and raising the water level behind their dams. This has had the unintended but desired consequence of regulating flow, slowing water velocity, developing natural sediment traps, and enhancing vegetation near the dams.
Marsh Creek at Outlet of C-3 Pool
Twenty-four discharge measurements were made at this site between September 16, 1998 and May 17, 2000 (table 1, appendix A). Discharge was measured as or observed to be zero on 16 occasions. However, prior to July 1999, water was not routinely discharged at this site other than to test the operation of the control structure when it was built (Michael Tansy, oral communication, 1998, 2000).
On July 6 and 7, 1999, a 2-day test discharge was made at this site. The maximum measured discharge was 0.878 cms, which is near the design maximum for the site (Michael Tansy, oral commun., 1999). A discharge of 0.878 cms was again measured on March 28, 2000.
Sweeney Creek at Outlet of C-3 Pool
Sixteen discharge measurements were made at this site between September 16, 1998 and May 18, 2000 (table 1, appendix A). Discharge was measured as or observed to be zero on 4 occasions between October 15 and November 5, 1999. However, this is not unexpected as flow in the creek is regulated. When Refuge staff raise the level of C-3 Pool they shut off all flow to the creek. The greatest measured discharge at this site was 5.52 cms on April 6, 1999.The Driggs River flows along the eastern edge of the study area (fig. 1). Discharge measurements were made on 3 occasions at three sites on the Driggs River to document ground-water gains or losses. Measurements were made where state highway M28 crosses the Driggs River, approximately where Walsh Creek flowed into the Driggs River prior to the construction of Walsh Ditch and later C-3 Pool (diversion ditch), and approximately 11 km downstream of the study area (Chicago Farm). The diversion ditch, although maintained, is a relic from construction of the dike and pool system and is not currently used. A control structure on the ditch keeps water from entering it.
From highway M28 to approximately C-3 Pool, there are only 2 minor inflows into the Driggs River, both associated with remnant channels of Walsh Creek, and draining only a few hectares. A dike runs along the west side of the river, from approximately C-3 Pool to the most downstream measurement site, preventing any inflow of surface water into the river from the west side along this reach. There are only a few minor inflows from the east side along this reach. Discharge measurements made on March 9, 2000 indicate that discharge in the Driggs River increased between M28 and C-3, and then decreased slightly between C-3 and the Chicago Farm site. Discharge measurements made on March 27-28, 2000 and May 17, 2000 indicate that discharge in the Driggs River generally increases between successive downstream sites.
Ground-water levels throughout the study area varied between a few centimeters to more than a meter from lowest to highest values (table 2, appendix A). Water levels are generally highest in the spring, and lowest in late summer and early winter. The smallest variation in water levels occurred at Lower Walsh Ditch, downstream from C-3, where the range was generally less than 15 cm. Measurements at this site in August 1999, in the deep piezometer 2 m west of Walsh Ditch and the shallow piezometer 2 m east of Walsh Ditch, were more than 57 cm and 65 cm, respectively, lower than all others in these piezometers. Review of field notes recorded at the time indicates that these measurements are likely incorrect because of transcription errors, and they are not included in this interpretation.
Relation between ground water and surface water
Water levels measured throughout the study area indicate a close relation between ground water and surface water. Throughout the year, the Driggs River gains flow in downstream order, yet there are few surface inputs to account for the increased flow. Ground water is the most likely source of the increased flow. Likewise, the regional ground-water table and potentiometric surfaces are generally near or above the land surface, indicating ground-water discharge to the surface-water system. Only during periods of elevated surface-water levels, such as the spring runoff, is the surface-water altitude greater than the ground-water altitude.
In general, flow is downward in the ground water adjacent to Marsh and Ducey Creek, and ground-water heads are higher than surface water during periods of base flow. When surface-water levels are rising, such as during runoff events, surface-water levels exceed ground-water levels by a few centimeters. At Walsh Creek at M28, the potential for vertical flow of ground water is nearly zero, and surface-water stage is slightly higher than ground-water heads. At all three sites, ground-water levels closely mimic surface-water levels. In general, the data indicate ground-water discharge to the creeks along M28, which comprises base flow in these creeks.
In Walsh Ditch just upstream from C-3 Pool, surface-water is consistently about 30 cm higher than ground water. There is a beaver dam about 200 m downstream of this site, and the data indicate that the site was influenced by this beaver dam. This site is likely under backwater from both C-3 Pool and the beaver dam.
Along the face of C-3 Pool, immediately below the Dike, the potentiometric surface is higher than surface-water elevation. The potentiometric surface is likely influenced by C-3 Pool, which causes an elevated potentiometric surface and water table along the face of the Dike due to seepage. The potentiometric surface at both Marsh Creek and Sweeney Creek below C-3 Pool mimics changes in the elevation of C-3 Pool. At Sweeney Creek, where surface-water discharge has been occurring for some time, the potentiometric surface closely mimics the stream stage. At Marsh Creek, however, the potentiometric surface more closely mimics the level in C-3 Pool than the stream stage. Data from the latter part of the study indicate that this relation is beginning to change, and that the potentiometric surface is beginning to reflect the stage in Marsh Creek. As Marsh Creek continues to be used as the primary discharge point for C-3 Pool, there should be a gradual change in the potentiometric surface in front of C-3 Dike as the surface-water gradient shifts to reflect this discharge.
Surface-water and land-surface gradients trend S75ºE at about 2 m/km between M28 and Chicago Farm, a distance of about 15 km. The ground-water gradient trends between S40ºE and S60ºE and ranges from 3 to 4 m/km between M28 and Chicago Farm. The ground-water gradient near C-3 Pool trends S45ºE and ranges from 0.3 to 0.5 m/km over a distance of about 2 km. Between M28 and Chicago Farm the ground water gradient is about twice that of the surface-water gradient; however, near C-3 Pool the ground-water gradient is about one sixth to one quarter the surface-water gradient. Ground water likely intersects the land surface and contributes to surface-water discharge near C-3 Pool.
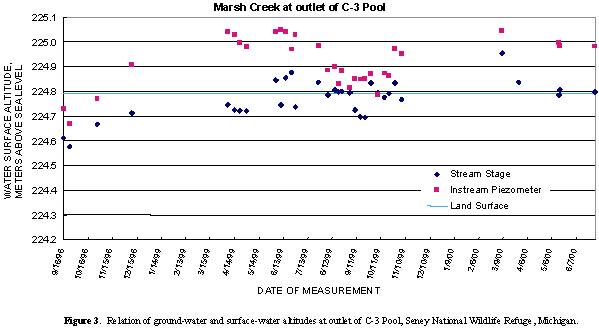
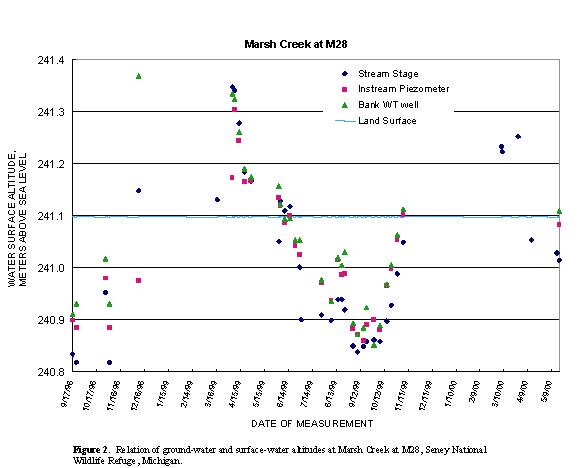
The relation between ground and surface water can be seen by comparing the altitude of ground water and surface water at project sites. Figure 2 shows this relationship at Marsh Creek at M28. During periods of baseflow, ground-water altitudes are generally higher than those of surface water by 5 to 10 cm. Likewise, figure 3 illustrates this relationship at Marsh Creek at the outlet of C-3 Pool, where ground-water altitudes are consistently higher than those of surface water by 10 to 20 cm. Data in tables 2 and 3 for all project sites indicate that this relation is generally true for sites along M28, although at Walsh Creek at M28 the relation is not as clear as at sites downstream from C-3 Pool. At Walsh Creek upstream from C-3 Pool and downstream of M28, surface-water altitudes are greater than ground-water altitudes; however, this site is under backwater from a beaver dam. Ground-water altitudes tend to mimic surface-water altitudes at this site, again indicating a close connection between the ground-water and surface-water systems. At Sweeney Creek below C-3 Pool, ground-water altitudes are again higher than surface-water altitudes, although not by as much as at Marsh Creek. This is likely because Sweeney Creek has been used as a discharge point for C-3 for many years, causing surface-water altitudes to be higher. Ground-water altitudes would also be lower because of a lower hydraulic head behind C-3 Pool near the Sweeney Creek control structure, causing a lowering of local ground-water altitudes.
Discussion of C-3 Watershed Hydrology
In the natural channel of Marsh Creek and Ducey Creek upstream from C-3 Pool, the combined maximum measured discharge on April 5 1999 was more than 3.12 cms, about 3.5 times the design capacity of the control structure on C-3 Pool at Marsh Creek. This indicates that the test discharge of 0.878 cms to Marsh Creek in July 1999 was probably well below the potential flow of the historical channel and flood plain. Marsh Creek below C-3 Pool likely has a potential flow equal to at least the combined maximum measured discharge of Marsh and Ducey Creeks at M28. Using the increase in flow measured in the Driggs River as a guide (table 1), an increase in flow in Marsh Creek between M28 and C-3 Dike of 22 percent might be expected, yielding a projected flow in Marsh Creek below C-3 Dike of 3.81 cms.
Likewise, if the maximum measured flow of 5.58 cms in Walsh Creek at M28 is increased by 22 percent, then Walsh Creek would have a potential into the Driggs River. Predicted peak flows in Walsh Creek could be as much as 75 percent of maximum measured flows in the Driggs River.
The combined potential flow of Marsh Creek and Walsh Creek, as calculated above, is greater than the maximum discharge measured in Walsh Ditch. Sweeney Creek has a maximum measured flow of 5.52 cms, which in itself is two-thirds the maximum measured discharge in Walsh Ditch. These measured and calculated discharge values indicate that natural drainage channels and flood plains are sufficient to carry the flow of water in C-3 watershed, and reconnecting them to their historical source of water likely would not cause impacts outside the realm of historical natural hydrologic events.
The impact of reduced flows in Walsh Ditch is more difficult to assess. Reduced flows should result in reduced erosion, revegetation, and with time, the redevelopment of a juvenile peat surface if the water table is at or near land surface. Reduced but reliable, constant flows might further encourage beaver activity, particularly if a food source redevelops. A healthy beaver population would serve to further regulate flow in the "spreads" by slowing water velocities, raising the local water table near their dams, and developing natural sediment traps behind their dams.
Although ground-water discharge was identified throughout the watershed, ground water is a minor component in the overall water budget of C-3 Pool, based on small gradients between ground water and surface water. Along the northern edge of the study area, ground-water discharge may contribute to base flow, but it likely is a minor component of total runoff. C-3 Pool creates an artificially high water table that causes seepage under and through the dike, creating water table and potentiometric surfaces along the face of the dike that are elevated with respect to surface water. A series of beaver dams on Walsh Ditch below C-3 Dike creates ponded surface water, which in turn tends to raise the water table and potentiometric surfaces in the immediate area of each beaver dam. Throughout the study area, the water table and potentiometric surfaces range from just below to just above land surface.
Potential effects of future management options
Effective implementation of the options for future management described below requires continued monitoring of ground water and surface water in the C-3 watershed. Data collected for this analysis were discontinuous, and there are gaps where additional data could enhance the interpretations contained in this report. Continuous, long-term data collection could enable managers to monitor changes that take place as modifications are made to the way water is routed through C-3 Pool, to identify trends in water levels and distribution, and to identify and take corrective actions that might be needed. Before beginning any modifications to the current system of creeks, ditches, dikes, pools, and control structures, long-term monitoring instruments would best be installed at key points throughout the area. Ideal locations for gages would be as follows:
Marsh Creek at M28
Ducey Creek at M28
Walsh Creek at M28
Driggs River at M28
In C-3 Pool
Walsh ditch below C-3 Dike control structure
Marsh Creek below C-3 Dike control structure
Sweeney Creek below C-3 Dike control
structure
Driggs River at the diversion ditch bridge
Permanent stream gages on Walsh and Marsh creeks upstream from C-3 Pool would be useful for determining the contribution of ground water to the hydrology of C-3 watershed. Data collected at these gages would provide immediate feedback to managers about the amount of water entering C-3 watershed at any given time and would show the natural distribution of water among incoming channels. This information would allow individual outlets of C-3 Dike to be opened the amount necessary to mimic the natural flow in each channel, thereby restoring natural variations in water flow. Consideration might also be given to establishing permanent ground-water monitoring sites throughout C-3 watershed to monitor changes in the ground-water system that are related to proposed changes in the surface-water system.
Although data presented in previous sections are useful for planning further modifications to structures in C-3 watershed, they do not indicate any one preferred solution to managing the inflow and outflow of water in the area. A number of data-based options are available for modifying the hydraulics, mechanics, and hydrology of C-3 watershed. Some will require verification by hydrologists, biologists, wildlife specialists, foresters, engineers, or other professionals, but all are based on data presented in this report.
Reconnection of historical channels
To restore surface-water flow to its presettlement condition, Marsh and Walsh Creeks would have to be reconnected to their former, natural channels. This could best be accomplished by blocking Walsh Ditch below its confluence with each of these creeks. Initially, flow into these creeks may overwhelm historical channels and floodplains, as they have not conveyed flowing water on a regular basis for as much as 80 years. There could possibly be considerable overland flow, erosion, and loss of vegetation. However, as was seen in Marsh Creek below C-3 Dike when flow was restored to that channel, these changes will likely be both minimal and gradual. Although there will have been some channel filling over time, vegetation within the filled channels will initially serve to reduce velocities, thereby minimizing erosion. As water fills the channels and infiltrates into surrounding soils and substrate, vegetation bordering the channels is likely to change, with dry species dying out and wet species taking over; however, this change is consistent with restoration goals because wet species were predominant before hydrologic alterations (Kowalski, 2000).
Blocking Walsh Ditch and reconnecting creeks to their historical channels will change how water arrives at C-3 Pool. Instead of entering the pool from the southwest at Walsh Ditch, only about a third of the flow would enter in this area, through Marsh Creek. The remainder would enter through Walsh Creek, which flows across the northern edge of C-3 Pool and would empty into C-3 Pool from the northeast. This could require some modification to the operation of C-3 Dike, and changes to both plant and wildlife habitat should be anticipated. Ground-water levels north of C-3 Pool would likely rise, and there may be some lowering of ground-water levels along the southwestern boundary of the C-3 watershed. Overall, however, these changes would serve to better distribute water across the area and to create a more uniform ground-water surface.
Blocking the reach of Walsh Ditch intermittently between Walsh Creek and Marsh Creek would raise ground-water levels in this reach, would reduce surface-water velocities, and would create the potential for sedimentation, which would help fill in Walsh Ditch. Rerouting of water will cause lower surface-water velocities near the current Walsh Ditch control structure, which might result in increased sedimentation behind the dam. This should be taken into account in designing a replacement structure.
Control structure on Walsh Creek to route flow into Driggs River
Historically, Walsh Creek flowed into the Driggs River near the northeast terminus of C-3 Pool. The Walsh Creek channel is still visible east of C-3 Dike between the dike and the Driggs River. If Walsh Creek is reconnected to its historical channel on the western side of the study area, a control structure in the eastern end of C-3 Dike at Walsh Creek should be considered to allow the diversion of Walsh Creek into either C-3 Pool or the Driggs River.
A comparison of discharges in Walsh Creek at M28 and the Driggs River at both M28 and the Diversion Ditch bridge during the period March through May 2000 shows that on average, Walsh Creek carries between 45 and 57 percent as much water as does the Driggs River. At low flow, flow in Walsh Creek may be as little as 9 percent of flow in the Driggs, but at high flows, such as during spring runoff, flow in Walsh Creek approaches 75 percent of flow in the Driggs River. Any control structure would need the capacity to handle this wide range of flows.
Increase capacity of Marsh Creek control structure
As shown previously, Marsh Creek and Ducey Creek at M28 combined can carry almost 4 times more water than the current control structure on Marsh Creek at C-3 Dike is capable of discharging. Before construction of Walsh Ditch, and subsequently C-3 Dike, the historical Marsh Creek channel below C-3 Dike carried the combined flows of Marsh Creek and Ducey Creek. Although it has been about 80 years since the historical channel carried this volume of flow, it is reasonable to suggest that it could carry it again. As with the historical Walsh Creek channel, there has been encroachment of vegetation and sedimentation in this channel, and in places, it no longer carries water. However, the reach below C-3 is maintained by ground-water discharge and beaver activity, and it is identifiable throughout its length to the Driggs River. This channel would need to be rerouted around Walsh Ditch south of the study area to avoid discharging into the lower reaches of Walsh Ditch.
Passive/active discharge along face of C-3
Additional methods of discharging water from C-3 Pool also might be considered. If a distribution of water across the study area that resembles sheet flow is desired, discharging along the face of C-3 Dike should be considered. This could be accomplished by building overflow pipes into the dike at both the maximum and minimum pool elevations. The lower (minimum elevation) pipes would need to have a control mechanism in them to allow them to be closed when the pool level needed to be raised. The upper (maximum elevation) pipes could be free flowing. This type of discharge mechanism offers some economy in that it has few moving parts, is mechanically and hydraulically simple, and should be relatively simple and inexpensive to design and install. Some sort of screen or cover mechanism would probably be needed on both ends of the pipes, however, as the flow of water through them will most likely attract beaver and other rodents, and could cause debris to accumulate, eventually blocking the flow of water through the pipe. Ice accumulation on or in the pipes could also be problematic.
Installing free-flowing pipes only at the maximum pool elevation, and regulating the minimum pool elevation with existing and/or proposed control structures would accomplish discharge control. A similar effect might be accomplished by designing a porous layer into the dike at the maximum pool level. This could be something as simple as a layer of porous rock or gravel designed into the structure of the dike at locations where discharge is desired.
Nearly one hundred years of modifications to the hydrology of Seney National Wildlife Refuge have changed the way water flows through C-3 watershed. The area known as the spreads on Walsh Ditch below C-3 Dike has experienced erosion and peat subsidence. The water table near C-3 Pool has been altered, and creeks have been diverted from their natural courses. Beaver populations have become dependent upon the flow of water in man-made channels, but have also remained active in abandoned natural channels that carry ground-water discharge. Wildlife populations have come to depend on artificial pools. Proposed changes to the hydrology in C-3 watershed include restoring creeks to their natural channels, restoring the flow of water in channels where blocked by artificial methods, and reducing or eliminating the flow of water in man-made channels.
A study of surface-water flows and ground-water levels in the C-3 watershed has shown these proposed changes to be feasible. To accomplish these modifications without negatively impacting wildlife and plant communities that are dependent on current conditions will require additional data collection and monitoring as modifications are made. A temporary discharge of water through a historical channel has shown that with proper monitoring, flow can be restored to these channels without damaging them. The data and field observations also indicate that artificial channels can be abandoned without significant, negative impact on local plant communities and with potential positive impact on local and possibly regional hydrology.