
Michigan Department of Environmental Quality (MDEQ) Source Water Assessment Program (SWAP) and the Detroit Water and Sewerage Department (DWSD), in cooperation with the U.S. Geological Survey (USGS), are assessing the vulnerability of public water intakes on the St. Clair-Detroit River Waterway to contamination. Intakes on this waterway provide a water supply to about one-third of the residents of Michigan. The assessments will identify likely sources of water to public intakes and provide a basis for preparing emergency responses to contaminant spills. Drifting buoy deployments described in this report were conducted to better understand flow patterns and turbulent dispersion characteristics that are needed to complete the assessments for Detroit River.
Detroit River is a connecting channel between Lake St. Clair and Lake Erie that forms part of the international boundary between the United States and Canada (Figure 1). In addition to being a major commercial navigation route through the Great Lakes, the river provides a drinking water supply to major metropolitan areas including the city of Detroit, Michigan, and the city of Windsor, Ontario.
Detroit River discharges an average of about 186,000 ft3/s from a drainage area of about 228,800 mi2, which includes water that flows out of the Lake Superior, Lake Michigan, and Lake Huron basins. Detroit River is about 32 mi long from the outlet of Lake St. Clair to Lake Erie. Water levels fall about three feet along the river.
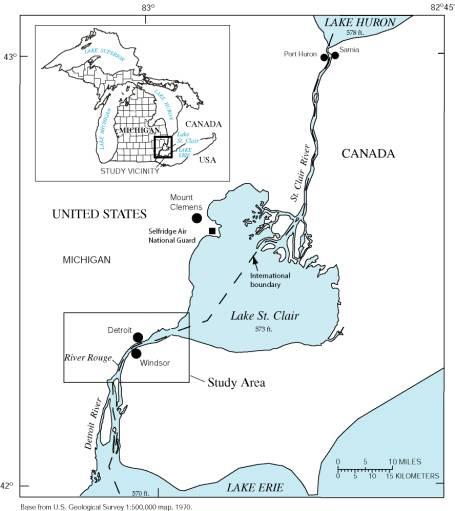 Figure 1. St. Clair-Detroit River Vicinity Map
Drifting buoys, which carried global positioning system (GPS) receivers, were deployed to help describe flow patterns and turbulent dispersion characteristics within four selected reaches of the Detroit River. Computer animations showing the generalized buoy movements during these deployments are developed to aid visualization of the results. Flow, water level, and wind data are provided as supporting information. Further analysis and interpretation of these data are underway to quantify hydraulic properties of the river for the source water assessment analysis.
The U.S. Army Corps of Engineers (USACE) Detroit District conducted an aerial survey of surface velocities on Detroit River in 1974 (U.S. Army Corps of Engineers, 1974). This survey used drogues to provide comprehensive information on surface velocities throughout Detroit River. A similar survey of St. Clair River was conducted in 1982 (U.S. Army Corps of Engineer, 1983). A drifting buoy study of St. Clair River, similar to that described in this report for Detroit River, was conducted by Holtschlag and Aichele (2001).
The work described in this report was supported by cooperative funding from the Michigan Department of Environmental Quality (MDEQ) Source Water Assessment Program (SWAP), the Detroit Water and Sewerage Department (DWSD), the American Water Works Association Research Foundation (AWWARF), and the U.S. Geological Survey. Brad Brogren, Neil Godby, and Stephen Ashford of MDEQ, Gang Song of DWSD, and Aaron Thompson of Environment Canada assisted with field deployments of the drifting buoys. In addition, Brad Brogren and Aaron Thompson provided the photographs contained in this report. Paul Taylor, Benjamin Harrison, and John Koschik of the USACE Detroit District measured and compiled flow data on Detroit River and River Rouge. Daniel McGrew, Selfridge Air National Guard, provided wind velocity data. Spherical buoys used in the deployments were made available through the National Stream Quality and Accounting Network (NASQAN) program by Richard Hooper. Gregory Kennedy of the USGS drove the deployment boat, and Jeffery Hukill of the USGS assembled the cylindrical buoys and drogues. The contributions of these organizations and individuals that made these deployments possible are greatly appreciated.
Four reaches were selected on Detroit River to investigate flow pattern and turbulent dispersion characteristics. The reaches were selected either because of the need to understand flow pattern near public water intakes or because the simplicity of the channel geometry and flow patterns could facilitate the interpretation of dispersion characteristics. Reaches satisfying these criteria were in upper Detroit River, upstream of Fighting Island. An overview of reach characteristics is provided in the following paragraphs.
Windmill Point. The Windmill Point reach of Detroit River is located near the outlet of Lake St. Clair between Peche Island and Belle Isle (Figure 2). The reach, which is about 3 mi long, is associated with the Windmill Point water-level gaging station (9044049) operated by the National Oceanic and Atmospheric Administration (NOAA). The islands and channelized parts of the reach create significant variability in the widths, depths, and orientations of the subreaches. Most commercial shipping passes through the Fleming Channel of Detroit River, which lies north of Peche Island and south of Belle Isle. Within upper Fleming Channel, dredging is used to maintain a 26-ft deep channel with a width of 800 to 1200 ft; lower parts of Fleming Channel have a uniform depth of about 30 ft. Numerous marinas are located on the branch of Detroit River that is north of Belle Isle. Depths in the upper part of this branch range from 18 to 28 ft; depths in lower parts of this branch near Scott Middle Ground may be as shallow as 1 ft. The average bearing of the Windmill Point reach is about 67 degrees east of true north. Public water intakes are located within the reach.
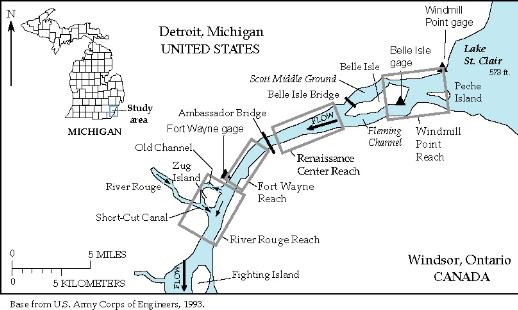 Figure 2. Selected reaches in the Detroit River upstream from Fighting Island.
Renaissance Center. The Renaissance Center reach of Detroit River is located downstream from Belle Isle and upstream from the Ambassador Bridge (Figure 2). The reach is adjacent to landmark buildings of downtown Detroit, Michigan, including the Renaissance Center and Cobo Hall, and passes over the motor vehicle and rail tunnels between the United States and Canada. The Renaissance Center reach is straight, about 2.3 mi long, with a bearing of 71 degrees east of true north. The width of the reach contracts from about 2,800 ft to 2,200 hroughout its length. Across the channel, depths are generally uniform and average 36 ft along the international boundary; some deepening occurs with increasing distance dwonstream.
Fort Wayne. The Fort Wayne reach of Detroit River is located 2,000 ft downstream from Ambassador Bridge and 1,000 ft upstream from the mouth of River Rouge on Detroit River. The reach is adjacent to historic Fort Wayne, a star-shaped fort built in the 1840s, and to the Fort Wayne water-level gaging station (9044036) maintained by NOAA. The reach is about 1.5 mi long and 1,900 ft wide. The reach is straight with a bearing of 34.5 degrees east of true north. Depths are uniform along the centerline of the channel and average about 40 ft.
River Rouge. The River Rouge reach of Detroit River forms the eastern side of Zug Island, which is otherwise surrounded by River Rouge. The Old Channel of River Rouge forms the western and northern boundaries of Zug Island; the southern boundary is formed by the Short-Cut Canal of River Rouge. Water commonly flows from Detroit River into the Old Channel and circulates around the island, where it joins with River Rouge and flows back into Detroit River through the Short-Cut Canal. The River Rouge reach is 2.1 mi long with a uniform width of about 2,500 ft. Depths are uniform and average about 32 ft along the centerline of the channel. The reach is straight with a bearing of 20 degrees east of true north. The ore docks on Zug Island adjacent to Detroit River are a distinctive feature of the reach.
Buoy and Drogue Characteristics
Twenty cylindrical and five spherical buoys (Figure 3)
were used in the Detroit River
buoy deployments to track the movement of water in the upper 5 ft of the water column.
Similar types of drogues were suspended below both types of buoys to reduce the effects of
wind. Despite the differences in the buoy shapes, the drifting characteristics of the two
types of buoys appeared similar. Thus, no distinction is made between the types of buoys in
the computer animations of buoy movements. Not all buoys provided data for all deployments
because of difficulties associated with obtaining or recording the GPS signals or recovering
the buoys.
The cylindrical buoys were constructed by joining a 9-inch length of 3-inch diameter PVC
(polyvinyl chloride) pipe with an 18-inch length of 4-inch diameter PVC pipe. The 3-inch
diameter pipe floated above the waterline and contained a Garmin GPS 12 unit that was set
to internally record time and position at 15-second intervals. The positional accuracy of
the Garmin GPS units, which was specified before the end of the U.S. Department of Defense
Selective Availability program in May 2000, was 49 ft (Garmin Corporation, 1999). The
4-inch diameter part of the cylindrical buoys provided buoyancy.
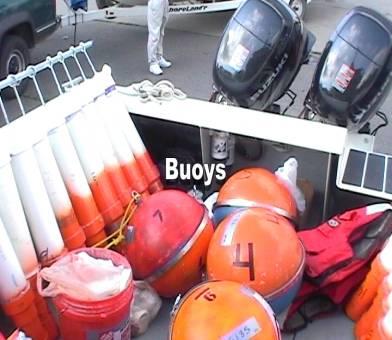 Figure 3. Cylindrical and spherical buoys used in Detroit River deployments.
The spherical buoys are surface drifters that were originally designed for extended
deployments in ocean environments by Clearwater Oceanographic Instrumentation. These buoys
are about 16 inches in diameter and weigh about 45 lbs (Figure 3). They are equipped
with telemetry to transmit time and position data at uniform intervals. For Detroit River
deployments, the electronics of these buoys were enhanced to decrease the sampling interval
from 30 minutes to about 90 seconds and to increase the positional accuracy from about 700
ft to about 70 ft. Local interferences affecting the hand-held receivers carried on the
deployment boat, however, often reduced the effective sampling interval to more than 180
seconds.
Drogues were suspended below both the cylindrical and spherical buoys (Figure 4) to reduce
the effect of winds on buoy movements. Drogues were formed by two vertically oriented
planes set at right angles to one another along a weighted line. Each plane was constructed
of nylon fabric that was 18 inches tall and 30 inches wide. The fabric was stretched between
1-inch PCV tubing. A weight of about 3 lbs was secured to the bottom of the
drogues to help maintain the vertical orientation of the buoys and drogues.
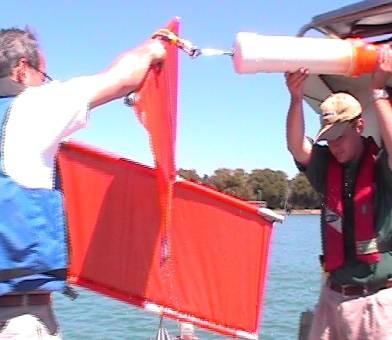 Figure 4. Drogue attached to a cylindrical buoy to reduce effects of wind on buoy movements.
Buoy deployments began August 28, 2001, in the Windmill Point reach of Detroit River.
Deployments in the remaining reaches continued in downstream order during the following two
days. Multiple buoy deployments were made for each reach. All operating buoys were used
for each deployment. All deployments in a reach were completed before the next reach was
studied. The times of buoy deployments and retrievals are shown in Table 1. The average
duration of buoy drifts was one hour and ten minutes.
Buoys were deployed from a boat (Figure 5) either in a transect or a cluster. Transect
deployments were made by crossing the reach normal to flow at a constant speed and releasing
the buoys along a line at approximately equal intervals. Release points were determined
based on precomputed deployment coordinates and an onboard GPS unit. Transect deployments
were used to map surface velocities and determine flow patterns.
Cluster deployments were made from a boat that was drifting downstream with the current.
Buoys released in a cluster were closely spaced, but sufficiently separated to avoid
entanglement as they drifted downstream (Figure 6). In the straight reaches downstream
from Windmill point, cluster deployments were paired at points along the same transect at
distances of about one-third and two-thirds of the channel width. The pairing provides a
means for assessing the reproducibility of turbulent dispersion characteristics interpreted
from the spreading of the buoy clusters with time.
Table 1. Timing of buoy deployments on Detroit River
| Reach | Deployment description | Day in August 2001 |
Deployment and Retrieval |
End2 | Duration Hr:Min |
|---|---|---|---|---|---|
| Belle Isle | North transect | 28 | 10:23 a.m. | 11:35 a.m. | 1:12 |
| North cluster 1 | 28 | 1:12 p.m. | 2:09 p.m. | 0:57 | |
| North cluster 2 | 28 | 3:50 p.m. | 4:47 p.m. | 0:57 | |
| South transect and North cluster 3 | 28 | 5:30 p.m. | 6:20 p.m. | 0:50 | |
| Renaissance Center | West cluster | 29 | 8:02 a.m. | 9:42 a.m. | 1:40 |
| Transect | 29 | 10:18 a.m. | 11:21 p.m. | 1:03 | |
| East cluster | 29 | 12:28 p.m. | 1:38 p.m. | 1:10 | |
| Fort Wayne | West cluster | 29 | 2:02 p.m. | 2:55 p.m. | 0:53 |
| Transect | 29 | 3:50 p.m. | 4:28 p.m. | 0:38 | |
| East cluster | 29 | 4:56 p.m. | 5:45 p.m. | 0:49 | |
| River Rouge | West cluster | 30 | 7:44 a.m. | 9:41 p.m. | 1:57 |
| Transect | 30 | 10:42 a.m. | 12:16 p.m. | 1:34 | |
| East cluster | 30 | 12:54 p.m. | 2:30 p.m. | 1:36 |
1 Start times refer to the time the first buoy was deployed.
2 End times refer to the time that the first buoy was retrieved.
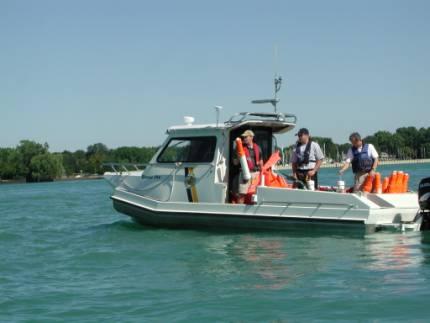 Figure 5. Crew members from Detroit Water and Sewerage Department, Environment Canada, and U.S. Geological Survey preparing to deploy drifting buoys on Detroit River.
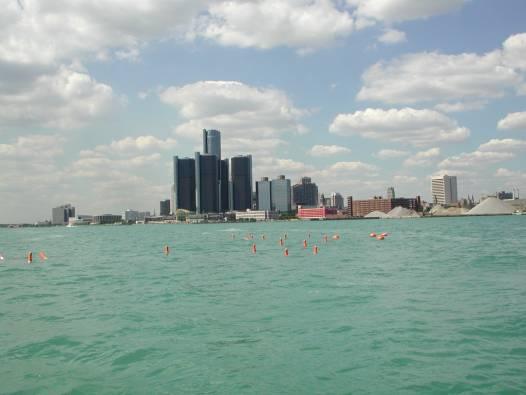 Figure 6. Buoy cluster deployment on Detroit River upstream from the Renaissance Center, Detroit, Michigan.
For constant water level conditions, changes in flow (discharge) directly affect flow velocities indicated by buoy movements. USACE Detroit District routinely measures flow on Detroit River by use of ADCP (Acoustic Doppler Current Profilers), and provided additional measurements to support the buoy deployments in studied reaches (Figure 7). Flow measurements averaged 190,100 ft3/s on Detroit River in the Windmill Point reach during buoy deployments on August 28, 2001(Table 2). Flow measurements averaged 179,500 ft3/s during buoy deployments in the Renaissance Center reach on August 29, 2001. Later on that day, flow measurements in the Fort Wayne reach averaged 181,200 ft3/s on Detroit River and 2,640 ft3/s on the Short Cut Canal of River Rouge. Flow measurements averaged 171,700 ft3/s during buoy deployments in the River Rouge reach of Detroit River on August 30, 2001. The average flow at the mouth of Old Channel of River Rouge, was -2,520 ft3/s, indicating that water was flowing out of Detroit River. Flow at the mouth of Short-Cut Canal of River Rouge, which receives water from upper River Rouge and Old Channel, averaged 2,870 ft3/s into Detroit River.
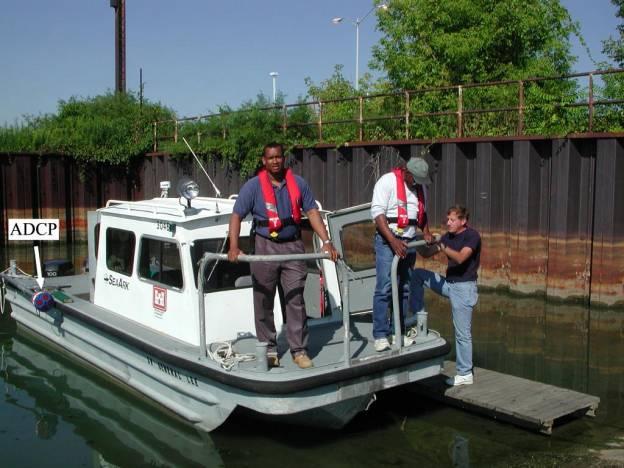 Figure 7. U.S. Army Corps of Engineers and Michigan Department of Environmental Quality staff preparing for flow measurements on Detroit River using an Acoustic Doppler Current Profiler (ADCP)
Table 2. Flow measurements during buoy deployments on Detroit River
| Date | Flow measurement cross section[1] |
Flow measurement event
|
Eastern Standard Time
|
Measured flow (cubic feet per second)
|
|---|---|---|---|---|
| Aug. 28, 2001 | CS-045 |
1
|
6:52 a.m.
|
183,300
|
|
2
|
7:03 a.m.
|
185,200
|
||
| CS-003 |
1
|
10:21 a.m.
|
147,500
|
|
|
2
|
10:43 a.m.
|
147,600
|
||
| CS-012 |
1
|
11:26 p.m.
|
202,100
|
|
|
2
|
11:55 p.m.
|
194,000
|
||
| CS-015 |
1
|
12:58 p.m.
|
58,990
|
|
|
2
|
1:15 p.m.
|
58,330
|
||
| CS-012 |
1
|
1:58 p.m.
|
189,800
|
|
| CS-008 |
1
|
2:36 p.m.
|
48,110
|
|
|
2
|
2:46 p.m.
|
48,350
|
||
| CS-029 |
1
|
3:17 p.m.
|
126,300
|
|
|
2
|
3:33 p.m.
|
127,800
|
||
| CS-012 |
1
|
3:52 p.m.
|
183,500
|
|
| Aug. 29, 2001 | CS-033 |
1
|
7:21 a.m.
|
172,000
|
|
2
|
7:40 a.m.
|
170,800
|
||
| CS-033 |
1
|
8:12 a.m.
|
172,800
|
|
|
2
|
8:34 a.m.
|
173,700
|
||
| CS-033 |
1
|
10:11 a.m.
|
184,700
|
|
|
2
|
10:51 a.m.
|
185,300
|
||
| CS-036 |
1
|
11:11 p.m.
|
184,900
|
|
| CS-038 |
1
|
11:41 p.m.
|
184,600
|
|
| CS-040 |
1
|
12:21 p.m.
|
182,400
|
|
| CS-033 |
1
|
12:53 p.m.
|
184,200
|
|
| CS-045 |
1
|
2:42 p.m.
|
183,900
|
|
|
2
|
2:52 p.m.
|
185,900
|
||
| CS-045B |
1
|
3:16 p.m.
|
-2,760
|
|
|
2
|
3:19 p.m.
|
-2,830
|
||
|
3
|
3:21 p.m.
|
-2,730
|
||
|
4
|
3:25 p.m.
|
-2,520
|
||
|
5
|
3:28 p.m.
|
-2,460
|
||
|
6
|
3:30 p.m.
|
-2,670
|
||
|
7
|
3:33 p.m.
|
-2,520
|
||
| CS-045 |
1
|
3:46 p.m.
|
182,600
|
|
|
2
|
3:57 p.m.
|
179,000
|
||
|
3
|
4:19 p.m.
|
179,500
|
||
|
4
|
4:31 p.m.
|
176,100
|
||
| CS-045 |
1
|
4:58 p.m.
|
174,900
|
|
|
2
|
5:20 p.m.
|
175,100
|
||
|
3
|
5:38 p.m.
|
175,100
|
||
| Aug. 30, 2001 | CS-045 |
1
|
7:38 a.m.
|
170,900
|
|
2
|
7:52 a.m.
|
169,900
|
||
| CS-045B |
1
|
8:16 a.m.
|
-2,620
|
|
|
2
|
8:19 a.m.
|
-2,580
|
||
|
3
|
8:21 a.m.
|
-2,510
|
||
|
4
|
8:23 a.m.
|
-2,080
|
||
|
5
|
8:25 a.m.
|
-3,020
|
||
|
6
|
8:27 a.m.
|
-3,000
|
||
|
7
|
8:30 a.m.
|
-2,630
|
||
|
8
|
8:32 a.m.
|
-2,550
|
||
| CS-045C |
1
|
8:48 a.m.
|
2,150
|
|
|
2
|
8:52 a.m.
|
2,570
|
||
|
3
|
8:56 a.m.
|
3,460
|
||
|
4
|
9:00 a.m.
|
3,440
|
||
|
5
|
9:07 a.m.
|
3,170
|
||
|
6
|
9:10 a.m.
|
3,480
|
||
|
7
|
9:15 a.m.
|
2,910
|
||
|
8
|
9:19 a.m.
|
3,180
|
||
|
9
|
9:23 a.m.
|
2,540
|
||
| CS-054 |
1
|
9:40 a.m.
|
173,100
|
|
|
2
|
9:56 a.m.
|
170,600
|
||
| CS-045C |
1
|
10:24 a.m.
|
2,960
|
|
|
2
|
10:29 a.m.
|
2,790
|
||
|
3
|
10:33 a.m.
|
2,660
|
||
|
4
|
10:36 a.m.
|
2,720
|
||
|
5
|
10:40 a.m.
|
2,870
|
||
|
6
|
10:43 a.m.
|
2,720
|
||
|
7
|
10:46 a.m.
|
2,430
|
||
|
8
|
10:49 a.m.
|
2,810
|
||
| CS-045 |
1
|
11:20 a.m.
|
174,900
|
|
|
2
|
11:30 1.m.
|
175,000
|
||
| CS-054 |
3
|
12:04 p.m.
|
171,700
|
|
| CS-045B |
1
|
1:00 p.m.
|
-2,510
|
|
|
2
|
1:02 p.m.
|
-2,170
|
||
|
3
|
1:04 p.m.
|
-2,370
|
||
|
4
|
1:07 p.m.
|
-2,300
|
||
|
5
|
1:08 p.m.
|
-2,540
|
||
|
6
|
1:11 p.m.
|
-2,340
|
||
| CS-045 |
1
|
1:23 p.m.
|
167,800
|
[1] Approximate locations of standard cross sections used by the U.S. Army Corps of Engineers Detroit District to measure flow are shown on the animations, which are accessible in the results section of this report. In some cases, the locations and identifiers of cross sections measured during this study differed slightly from standard cross sections locations and identifiers. Because the flow measured through the corresponding branches measured at these cross sections is not expected to change because of these minor differences, the distinctions in locations and identifiers is not shown on the animations or maintained in this table.
On Detroit River upstream of Fighting Island, water levels are monitored at Windmill Point and Fort Wayne by NOAA (gaging stations 9044049 and 9044036, respectively) and by USACE at Belle Isle (gaging station CE 737 832). Differences in water levels between reaches provide the hydraulic gradient necessary for flow to occur. In the Windmill Point reach, the difference between water levels at Windmill Point and Belle Isle from August 28-30, 2001, averaged 0.13l ft, producing a gradient of 1.15x10⁻⁵ ft/ft (Figure 8). During the same period, differences in water levels between gages at Belle Isle and Fort Wayne averaged 0.48 ft, for a gradient of 1.22x10⁻⁵ ft/ft. Water levels at the three gaging stations varied about 0.35 ft during the three-day period.
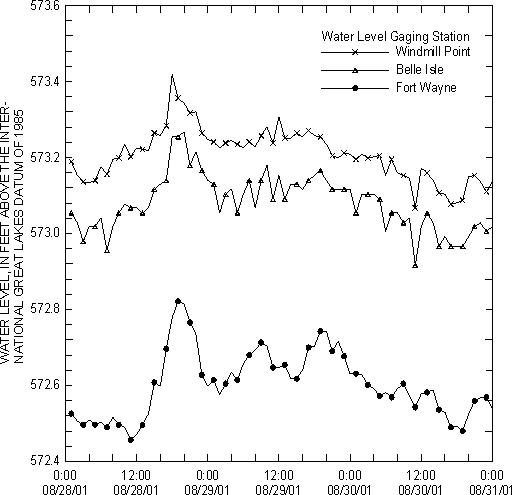 Figure 8. Water levels at gaging stations on upper Detroit River from August 28-30, 2001.
The drifting buoys were equipped with drogues that extended to a depth of about 5 ft below the water surface. These drogues were designed to reduce the direct effects of wind on the movements of the buoys. Wind may have had an indirect effect on their movement, however, by influencing the upper surface velocities in Detroit River. Wind data from Selfridge Air National Guard Base (ANGB) (Daniel McGrew, Selfridge ANGB, written commun., 2001), which is about 20 mi northeast of upper Detroit River, indicate light to moderate winds of 5-10 knots during most of August 28, 2001 (Figure 9a), low to light winds on August 29, 2001 (Figure 9b), and light to moderate winds from the south on August 30, 2001 (Figure 9c).
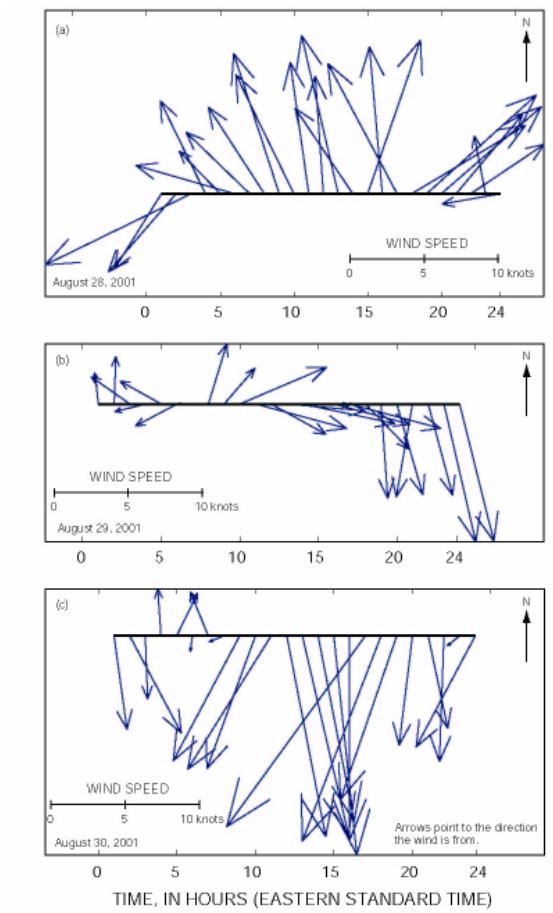 Figure 9. Wind data from Selfridge Air National Guard Base near Mount Clemens, Michigan
Buoy animations were developed using Adobe® LiveMotion™, a software product of Adobe Corporation. Background images for the animations were scanned from recreational charts (National Oceanic and Atmospheric Administration, 1999) published at a scale 1:15,000. The pixel coordinates of the scanned images were registered with positional information on the maps to facilitate plotting of buoy locations. Buoy locations were generally included at about 2-minute intervals, when GPS data were available. Between measured locations, buoy positions were interpolated by use of a Bezier curve. Pairs of Macromedia® Flash™ file format (SWF) and hypertext markup language (HTML) files were created to display the animation through the Internet.
Animations of buoy deployments can be viewed by clicking on any of the four rectangular areas corresponding to reaches in Figure 10. The rectangular areas contain links to HTML and Flash files, which can be viewed by a standard browser such as Microsoft® Internet Explorer or Netscape® Communicator with the Macromedia® Flash plugin. Controls are provided on the animations to stop, play continuously or frame by frame, and restart the animation. A standard Internet browser and a Flash file reader plugin are available without charge from the corresponding software developers.
 Figure 10. Links for animations of buoy deployments on Detroit River upstream of Fighting Island.
Michigan Department of Natural Resources and the Detroit Water and Sewerage Department, in cooperation with the U.S. Geological Survey, is assessing the vulnerability to contamination of public water intakes on the St. Clair-Detroit River Waterway. As part of this assessment, drifting buoys were deployed on Detroit River upstream of Fighting Island from August 28-30, 2001. Global positioning system receivers carried in the drifting buoys helped track their movement with flow during these deployments. Buoy deployments along transects normal to flow were used to describe flow patterns, and deployments in clusters were used to describe turbulent dispersion characteristics. Results of these deployments were animated to facilitate visualization of the results and further study. Ancillary data from flow, water level, and wind measurements provide data to support future interpretations of the results. The animations are available through the Internet to those interested in the flow characteristics of Detroit River.
