
INTRODUCTION
Grassy Island is one of two islands which, including surrounding waters, comprise the Wyandotte National Wildlife Refuge (WNWR). The WNWR was established in 1960 and is administered by the Shiawassee NWR (Fish and Wildlife Service, Department of the Interior) as wilderness. Since the early 1960’s, Grassy Island has also been used by the Army Corps of Engineers as a Confined Disposal Facility (CDF) for contaminated sediments dredged from the Rouge River (95%), the Trenton Channel of the Detroit River (3%), and other undetermined sources (2%). Construction of this CDF preceded laws that have applied to Great Lakes CDFs since the early 1970’s. Therefore, it lacks confinements, caps, liners, and other characteristics of newer CDFs. The 29.1 hectare (h)(72 acre) facility was designed to retain 1.45 million cubic meters (m3)(310 million ft3) of sediment, and little of that capacity remains. Most of the facility supports a variety of types of vegetation, and two small ponds near overflow weirs provide habitat for waterfowl.
Limited investigations of the facility (Best and others, 1992), conducted by the Fish and Wildlife Service (FWS), indicate contamination of the dredged sediments and soils on the island with organic compounds (chlordane, DDE, DDD, PAHs, and PCBs, among others) and heavy metals (especially mercury and lead). Elevated levels of selected organic compounds and lead have been found in tissue samples of waterfowl. Earthworms taken from soils on the island have been found to have elevated levels of mercury in their tissue (Beyer and Stafford, 1993).
As part of the National Performance Review (NPR) (Gore, 1993), Grassy Island was selected as an U.S. Department of the Interior Hazardous Materials Management (HAZMAT) demonstration cleanup site. In March 1996, FWS initiated collaborative discussion within the Technical Oversight Team to evaluate the type and range of studies needed to determine the extent of contamination on the island and if contaminants are leaking from the island. Prior to HAZMAT consideration, preliminary sediment samples collected on the island indicate contamination with oil and volatile solvents (Best and others, 1992; Beyer and Stafford, 1993). Further investigations of contaminant movement in ground water (by the U.S. Geological Survey (USGS), Water Resources Division), the kinds and amounts of contaminants on the island (by the FWS), and effects of the contaminants on the quality of habitat for fish and wildlife on and near the island (by the USGS Biological Resources Division) will be conducted with funding from the FWS Refuge Cleanup Fund. In November 1996, a seismic survey was conducted in the water surrounding the island to determine the lithology of the sediments and rocks surrounding the island. This information will facilitate the study of contaminant movement in ground water and between ground- and surface-water. The results of this survey are presented below.
PURPOSE AND SCOPE
This report presents the data collected during a November, 1996 high-resolution continuous seismic-reflection survey of the shoals around Grassy Island. With this report, the data and findings concerning those data are transmitted to FWS. The scope is limited to 3.5 and 14 kilohertz (kHz) data collected over a 3 day period, from November 18 through 20, 1996.
DESCRIPTION OF STUDY AREA
Grassy Island (WNWR) is located in the Detroit River (figure 1) east of Wyandotte, MI, and at the time of its creation included an area under the water to the 1.83-meter (m) (6-feet (ft)) contour interval. In 1972, this area included shoals north of the island to a point east of Mud Island, and south of the island to the southern-most extent of the Mamajuda Island Shoal (National Oceanic and Atmospheric Administration, 1972). The island is bounded to the north and west by the Trenton Channel, and to the east and south by the Fighting Island Channel. Total area comprised by WNWR is about 130 h (321 acres).
Of particular interest to this study is the approximately 100 h (250 acres) that lie below the surface of the Detroit River. The portion of WNWR below water is widest east-to-west just offshore at the north end of Grassy Island, and longest north-to-south offshore at the south end of the island. The area east of the island is very narrow and of limited extent. A bay on the west side of the island provides shallow water habitat for waterfowl.
ACKNOWLEDGMENTS
This investigation was conducted as part of a cooperative agreement between the USGS and FWS. Successful completion of this project would not have been possible without the cooperation of Doug Spencer, FWS, for providing a boat and logistical support for the study and the City of Wyandotte for providing access to their public boat launching facility.
GEOPHYSICAL METHODS
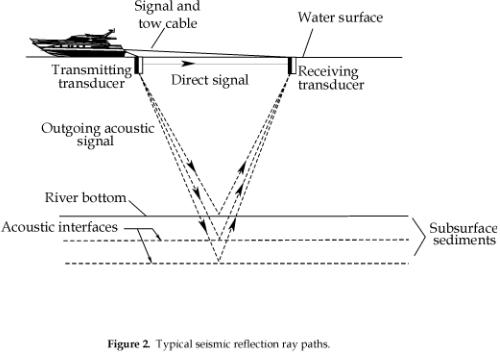
Continuous seismic-reflection profiling was used to map the water-sediment interface and details within the sediments below the submerged surface of WNWR. For this study, the equipment was operated from a boat (figure 2), and two different frequencies were used for an energy source. During equipment testing and setup on November 18, and during data collection on November 19, a tuned array of 2 transmitting transducers, operating at 3.5 kHz, and 2 receiving transducers was used to profile sediments from north-to-south on both east and west sides of the island, as well as to profile sediments from east-to- west near the southern end of WNWR (figure 1).
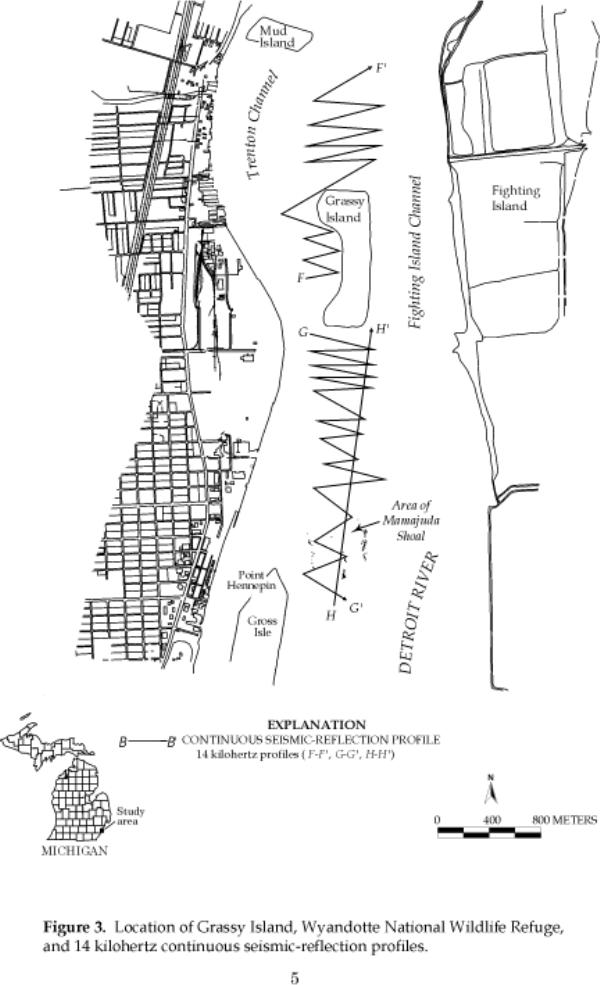
On November 20, a pair of 14 kHz transducers, one used as a transmitter, the other as a receiver, were used to conduct profiles in both east-to-west and west- to-east directions, and from southeast-to-northwest over WNWR (figure 3). Transducer frequencies were changed in an attempt to increase the resolution of features of the sediments and underlying bedrock.
A detailed description of the geophysical method and theory used in this study, along with a discussion of the advantages and disadvantages of the method, is given in Gorin and Haeni (1989), Haeni (1986), Haeni and Placzek (1991), and Placzek and Haeni (1995).
Figure 2. Typical seismic reflection ray paths
Data were collected from a total of 8 different profile paths. Five profiles were collected on November 19 using 3.5 kHz transducers, and 3 profiles were collected on November 20 using 14 kHz transducers. Where water depths exceed 8-12 m (26-40 ft), these areas likely represent the natural bottom contour of the river (U.S. Department of Commerce, 1972). Exceptions include areas on the east side of WNWR where consistent depths of 9.2 m (28 ft) represent artificial depths, maintained by dredging and blasting, for the Fighting Island Channel, and areas on the west side of WNWR where consistent depths of 8.5 m (27 ft) represent artificial depths, maintained by dredging and blasting, for the Trenton Channel.
Two 3.5 kHz profiles (A, B) were collected in a north-south direction along the entire length of WNWR, one on each side of Grassy Island (figure 1). One east-to- west, 3.5 kHz profile (C) was collected near the southern end of WNWR. This profile started in the Fighting Island Channel and ended near the Wyandotte Electric and Water Plant. The next 3.5 kHz profile (D) began near the Wyandotte Electric and Water Plant and traversed WNWR to the east-northeast, ending in the Fighting Island Channel. The final 3.5 kHz profile (E) began near the end point of the previous profile, and traversed WNWR to the northwest, ending in the Trenton Channel near the midpoint of Grassy Island.
The first 14 kHz profile (F) was collected in a zig-zag pattern, the equipment boat travelling west-to-east and east-to- west along a generally north-to-south path over the north end of WNWR and ending near the southern edge of the bay on the west side of Grassy Island (figure 3). The second 14 kHz profile (G) was collected in a similar fashion over the south end of WNWR, beginning off the southwest shore of Grassy Island and ending at the north end of Mamajuda Island Shoal. The final 14 kHz profile (H) traversed WNWR from south-to-north, beginning at the north end of Mamajuda Island Shoal and ending near the southeast corner of Grassy Island.
The location and track of each transect was recorded using real-time global positioning, with positions corrected at the time of collection using U.S. Coast Guard correction signals. The 3.5 kHz tracks are shown in figure 1, and the 14 kHz tracks are shown in figure 3. The results of these profiles are presented below.
RESULTS OF CONTINUOUS SEISMIC-REFLECTION PROFILING
3.5 kilohertz Continuous
Seismic-Reflection Profiles
Five profiles were collected with a pair of tuned 3.5kHz transducers as the energy source, and another pair as receivers. Profiles A through E (figure 1) were collected on November 19, 1996, and are discussed below.
Profile A was collected on the east side of WNWR, in a north-to-south direction, along the edge of the Fighting Island Channel (figure 1). Water depths ranged from 10 m (33 ft) at the north end of the profile to 9 m (29.5 ft) at the south end of the profile. It appears that sediment mantles the bedrock along the entire length of the profile. Sediment thickness ranges from about 3.7 to 4.9 m (12.1 to 16 ft) at the north end of the profile to 2.4 m (8 ft) at the south end of the profile. The sediment appears to be composed principally of clay, silt, fine sand, and some small gravel. These deposits are indicative of glaciolacustrine sediments overlain by a thin mantle of riverine sediments, as mapped by Farrand and Bell (1982).
Bedrock is evident below the sediments, and is likely from the Paleozoic, Devonian, Detroit River Group dolomites, with the Amherstberg Dolomite being the principal formation present (Milstein, 1987). It is not possible to determine the structure of the bedrock from this data.
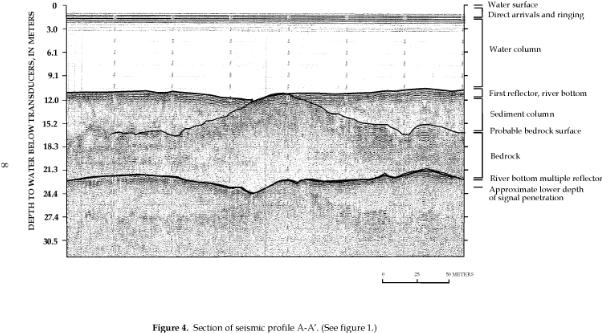
A selected section of profile A, from an area northeast of Grassy Island, is shown in figure 4. Beginning at the top of the figure, the first set of lines is the water surface. The cluster of wavy lines immediately below the water line represents direct arriving signals and ringing. Below this is an area of indistinct signals that are representative of the water column, which is about 10 to 12 m (33 to 39 ft) deep along this section. The strong reflections at the bottom of the water column represent the river bottom, which is the first reflector seen in this figure. Below this reflector is another area of indistinct signals that represent the sediments forming the river bottom. These sediments range in thickness from about 1 to 3 m (3.3 to 10 ft). A second reflector below the sediments represents the top of the bedrock surface. Below this set of reflectors is another apparent set of reflections; these reflections are river bottom multiple reflections, or echoes of the river bottom reflections.
Profile B was collected on the west side of WNWR, in a north-to-south direction, along the edge of the Trenton Channel (figure 1). Water depths ranged from about 10 m (33 ft) at the north and south ends of the profile, to about less than 1 m (3 ft) over parts of Mamajuda Shoal and shoals on the west side of the island. At the north end of this profile, sediments appear to be about 6 m (20 ft) thick, thinning near the northwest corner of Grassy Island. Immediately northwest of the island, in water depths of about 3 m (10 ft), sediments appear to be absent or very thin, over a bottom of broken or fractured bedrock. Reflections, which become indistinct near the south end of the island, appear to indicate an unconsolidated, fine-grained sedimentary deposit over bedrock.
Near the south end of Grassy Island, where the profile reenters deeper water, water depths were from 7.5 to 10 m (25 to 33 ft). Sediments were generally 1.5 to 3 m (5 to 10 ft) thick, but at some locations they are thinner and bedrock may be exposed, or covered with a mantle of riverine sediments.
Bedrock is evident below the sediments along the entire length of profile B, and appears to be generally level, with some raised areas and occasional troughs or small valleys. Near the north end of this profile, particularly on the north side of Grassy Island, bedrock appears blocky and broken, possibly with vertical fractures.
A selected section of profile B, from an area south of Grassy Island, along the edge of the refuge, is shown in figure 5. Beginning at the top of the figure, the first set of lines is the water surface. The cluster of wavy lines immediately below the water line represents direct-arriving signals and ringing. Below this is an area of indistinct signals that are representative of the water column, which is about 5 to 7 m (16 to 23 ft) deep along this section. The strong reflections at the bottom of the water column represent the river bottom, which is the first reflector seen in this figure. Below this reflector is another area of indistinct signals that represent the sediments forming the river bottom, except in the first and last thirds of the profile, where parabolic reflectors are seen. These parabolic reflectors are indicative of large rocks, boulders, or broken bedrock.
Figure 4. Section of seismic profile A-A'. (see figure 1.)
Figure 5. Section of seismic profile B-B". (See figure 1.)
Sediments range from about 5 to 7 m (16 to 23 ft) thick. A second reflector is seen below the sediments, and represents the top of the bedrock surface. Bedrock is highest on the south side of this section, and dips to the north. Below the bedrock reflector is another apparent set of reflections; these reflections are river bottom multiple reflections, or echoes of the river bottom reflections.
Profile C was collected south of Grassy Island, in an east-to-west direction, from just north of Mamajuda Island Shoal to the Wyandotte Electric and Water Plant (figure 1). This profile indicated water depths of just over 2 m (6.5 ft) over WNWR, with greater depths approaching the edge of the shoals and the shipping channels on either side of the Refuge. Over WNWR, sediment thickness appears to be about 6 m (20 ft). In this area, the sediment appears to be glacial till, with a layer of boulders at about two-thirds its depth.
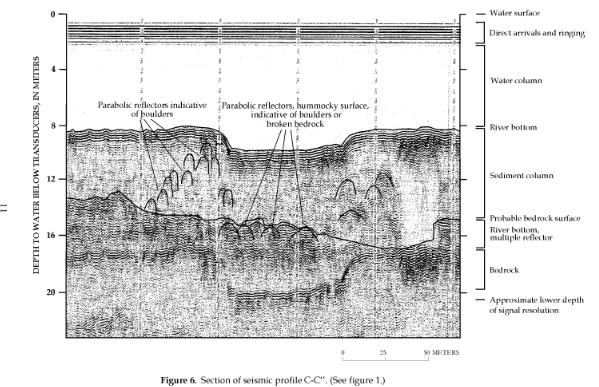
Bedrock is evident below the sediments, at a depth of 10 to 14 m (33 to 46 ft) below the water surface, and appears to be similar in composition and structure to that previously described. Figure 6 is a detail of this profile, collected near the west edge of WNWR. Water depth ranges from 8 to 10 m (26 to 33 ft). The sediment is predominantly glaciolacustrine and riverine clay, 5 to 6 m (16 to 20 ft) thick, with abundant large clasts and boulders. Bedrock at the contact with the sediment column is broken and hummocky.
Profile D was collected immediately north of profile C, from the west to the east-northeast, beginning at the Wyandotte Electric and Water Plant (figure 1). It is similar to profile C in all respects, with no remarkable differences.
Profile E began near the terminus of profile D, and was collected to the northwest, beginning in the Fighting Island Channel and terminating at the Trenton Channel, crossing WNWR in the process (figure 1). It is similar to the previous 2 profiles, C and D, in all respects, with no remarkable differences.
In general, the 3.5 kHz data showed a mantle of sediments, most likely glaciolacustrine till and riverine clay, overlying bedrock in most places. The bedrock is most likely Paleozoic, Devonian, Detroit River Group dolomites, from the Amherstberg Dolomite formation. The bedrock is generally coherent, although in places it appears to contain vertical fractures, or be of a blocky, bouldery texture. This could be a remnant of the dredging process used to deepen and widen the shipping channels that bound WNWR to the east and the west. It could also be related to basal ice structures from the glaciation that deposited the glaciolacustrine sediments commonly found in the area.
In most places, the 3.5 kHz data are not sufficient to allow determination of specific compositions within the sediments overlying the bedrock. Signal penetration into the subsurface appears limited to about 8 m (26 ft) (figure 6) to 12 m (39 ft) (figure 4), with greater depths of penetration where the sediments are thinnest.
Figure 6. Section of seismic profile C-C". (See figure 1.)
14 kilohertz Continuous
Seismic-Reflection Profiles
Three profiles were collected with a pair of tuned 14 kHz transducers; one transducer served as the energy source, the other as the receiver. Profiles F through H (figure 3) were collected on November 20, 1996, and are discussed below.
Profile F consists of 15 transects collected in east-to-west and west-to-east directions across the shallow north end of WNWR, with turns being made at the edge of both the Trenton Channel and Fighting Island Channel (figure 3). Data were collected in a continuous manner, with no break in collection during each turn. The profile was begun near the north extent of WNWR, and continued along the west side of Grassy Island over the shallow bay on the west side of the island. The southern terminus is about two- thirds of the way from the north end of Grassy Island, is west of the island, and is at the edge of the Trenton Channel. Sediment thickness appears to range from about 2 to 3 m (6.5 to 10 ft) at the north end of the profile to about 1.5 m (5 ft) at the south end of the profile. The sediment appears to be an undifferentiated glaciolacustrine till with a mantle of riverine sediments. A grab sample of sediment from the river bottom, taken about 6 m (20 ft) from shore at the north-central part of the island was composed of light gray/blue clay with some fine sand and abundant small pebbles.
Bedrock is evident below the sediments, and is likely from the Paleozoic, Devonian, Detroit River Group dolomites, with the Amherstberg Dolomite being the principal formation present (Milstein, 1987). It is not possible to determine structure or lithology from the seismic record because of poor penetration of signal.
Profile G consists of 21 transects collected in west-to-east and east-to-west directions across the shallow south end of WNWR, with turns being made at the edge of both the Fighting Island Channel and Trenton Channel (figure 3). Data were collected in a continuous manner, with no break in collection during each turn. The profile was begun near the southwest corner of Grassy Island, and continued to a point east of Point Hennepin on Grosse Isle, near the northern extent of Mamajuda Island Shoal.
Sediment thickness is indeterminate for most of this profile. Reflections from the river bottom are indicative of a less well consolidated surface than seen in previous profiles, possibly indicating plant materials, a fine, saturated, unconsolidated sediment, or degassing organic compounds, as indicated by a weaker signal and thus a less well defined reflection. Where reflections are sufficient to determine sediment thickness, it ranges from about 1.5 m to about 3 m (5 to 10 ft), with the thicker sediments generally near the southern end of the profile, and thinner sediments near the north end of the profile, closest to Grassy Island. Sediments are likely glaciolacustrine tills.
Bedrock is not evident in most of profile G, except at the edges of WNWR, where it appears on the record of some transects. In general, however, signal penetration is not sufficient to characterize the bedrock below the sediments.
Profile H is a single transect collected from south-to-north, beginning near the north end of Mamajuda Island Shoal, over water about 11 m (36 ft) deep, and terminating near the southeast corner of Grassy Island at the edge of Fighting Island Channel (figure 3). Over most of the course of profile H, water depths were only about 2 to 3 m (6.5 to 10 ft), although deeper areas were traversed at times. As with profile G, sediment thickness is generally indeterminate for much of the profile. First reflections are indicative of a surface that is not as well consolidated as surfaces seen in previous profiles, possibly indicating plant materials, a fine, saturated, unconsolidated sediment, or degassing organic matter. Where reflections are sufficient to determine sediment thickness, it ranges from about 1.5 m to about 3 m (5 to 10 ft), with the thicker sediments generally near the southern end of the profile, and thinner sediments near the north end of the profile, closest to Grassy Island. Sediments are likely glaciolacustrine tills.
Bedrock is not evident in most of profile H, although as the transect proceeds northeast a bedrock reflector becomes more evident as the water deepens, overlying sediments become more consolidated, and there is less organic and vegetative material present. The last quarter of the record indicates bedrock at a depth of about 13 m (43 ft), below about 3 m (10 ft) of sediment. Bedrock is likely from the Paleozoic, Devonian, Detroit River Group dolomites, with the Amherstberg Dolomite being the principal formation present. It is not possible to determine structure or lithology from the seismic record because of poor signal penetration.
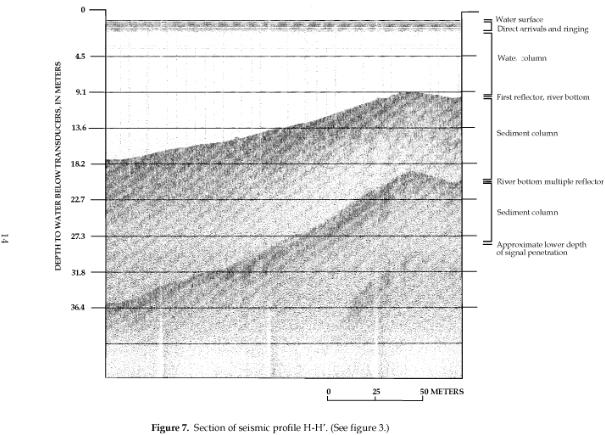
A selected section of profile H, from an area near the south end of WNWR, is shown in figure 7. Beginning at the top of the figure, the first set of lines is the water surface, followed by a cluster of wavy lines immediately below, which represents direct arriving signals and ringing. Below this is an area that appears to be clear of signals, which is representative of the water column. Water is about 9 to 14 m (29.5 to 46 ft) deep along this section. The strong reflections seen at the bottom of the water column represent the river bottom, which is the first reflector seen in this figure. Below this reflector is an area of distinct but nonaligned signals which represents the sediments forming the river bottom. Sediment thickness cannot be determined in this section, because the signal penetration depth in the sediments was not sufficient to reach bedrock, or because the contrast in acoustic impedance between the sediments and bedrock is too small to cause reflections (Gary Placzek, U.S. Geological Survey 1996, oral communication).
Comparison of figures 5 and 7 is instructive because it illustrates the differences between data collected at different frequencies. The data in figure 5 were collected using the 3.5 kHz transducers, and has a coarser, grainier appearance, than does the data collected with the 14 kHz transducers, shown in figure 7. In addition, the 3.5 kHz data resulted in better contrasts in acoustic impedance and penetration of the sediments and bedrock than did the 14 kHz data, allowing depth to bedrock and sediment thickness to be determined.
Summary of Geophysical Data
Both the 3.5 kHz and 14 kHz continuous seismic profiles indicate a bedrock surface overlain by well-consolidated native sediments. A thin layer of riverine deposits overlies the native sediments. Bedrock in the area is Detroit River Group dolomite, with the Amhertsberg Dolomite present in the area of Grassy Island. The Island itself is an area of thicker glacial deposits overlying relatively level bedrock (Wayne County Road Commission, 1957). Drawings made for the boring and construction of a water intake in the Fighting Island Channel for the City of Detroit Water and Sewerage Department indicate island sediments about 20 m (66 ft) thick at the north end of the Island before filling of the CDF, and sediment thickness of about 15 to 20 m (49 to 65.5 ft) over most of the area that makes up WNWR. Sediments are thinner near and under the Fighting Island and Trenton Channels where dredging has occurred.
Figure 7. Section of seismic profile H-H". (See figure 3.)
Extrapolating this information under the rest of Grassy Island indicates that the CDF is situated on approximately 15 to 20 m (49 to 65.5 ft) of native glaciolacustrine clays, which overlie competent and only occasionally fractured bedrock. Clays of this type typically have very low hydraulic conductivities and act as layers that block the flow of water or other fluids. In most areas, the underlying bedrock does not appear to be fractured or cavernous, which indicates that it, too, has a fairly low hydraulic conductivity and is thus not conducive to the ready flow of fluids.
DATA GAPS
The data collected by this work gives a suitable image of the sediments and underlying bedrock surrounding Grassy Island to make some inferences about the nature of the sediments and bedrock that underlie the Island. No direct data were collected over the Island and thus no direct statements can be made about the nature of the materials on which the Island is built. Previous work by Lewis (1991) indicates that materials under the Island are similar to those identified by this work. Further analysis of materials under the Island by seismic and coring methods would be required to make more definitive statements about the nature of such materials, including their hydraulic characteristics, competence, and thickness.
SUMMARY AND CONCLUSIONS
Results of the 3.5 kHz profiles and 14 kHz profiles are similar; it appears that sediment mantles bedrock along the length of most of the profiles, ranging in thickness from about 1 to 6 m (3.3 to 19.7 ft), although locally absent. Sediment thickness is more confidently determined with the 3.5 kHz records that with the 14 kHz records because of better penetration by the lower frequency signal. It appears that bedrock is present beneath the sediments at all locations covered by the seismic profiles; however, in most places it is difficult to recognize any determining features of the bedrock because of insufficient penetration by the seismic signal.
Results of the 3.5 kHz data in profiles C, D, and E indicate a more coherent, dense sediment than do the results of the 14 kHz data from profiles G and H. All 5 profiles indicate a similar bedrock surface below the sediments, although the surface is more evident in the 3.5 kHz data than in the 14 kHz data.
Results of all the profiles, both 3.5 kHz and 14 kHz, indicate sediment overlying bedrock in most areas of WNWR. A grab sample indicates the sediment is most likely a clay or of high-percentage clay composition, with small pebbles or stones in some areas. Additionally, 3.5 kHz profile C indicates a layer of larger stones or boulders in glaciolacustrine till in the southern part of WNWR. Profiles G and H, both collected at 14 kHz, and which cross profile C, do not indicate this same structure; however, it should be noted that the 14 kHz signal did not appear to penetrate the sediments to the same depth as the 3.5 kHz signal.
The origin of the sediments in WNWR is likely a glaciolacustrine till, mantled in many areas by a thin layer of riverine sediments. Underlying this sediment is bedrock, most likely of the Paleozoic, Devonian, Detroit River Group dolomites, with the Amherstberg Dolomite likely the principal formation present. Sediments are similar on all sides of Grassy Island and likely continue under and through the Island with a composition similar to that indicated by the seismic data. Likewise, bedrock is likely consistent across the section under the Island, with bedrock under the Island similar to that indicated by the seismic data.